3FFC

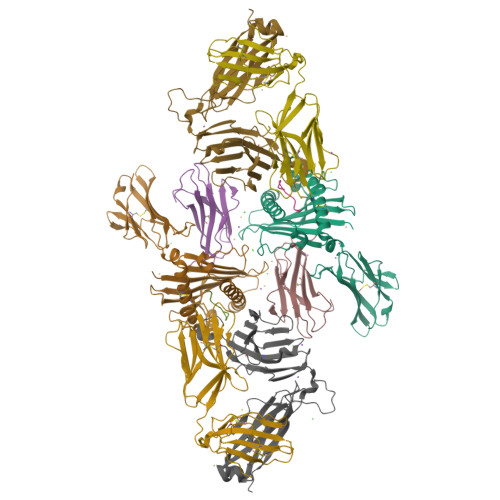
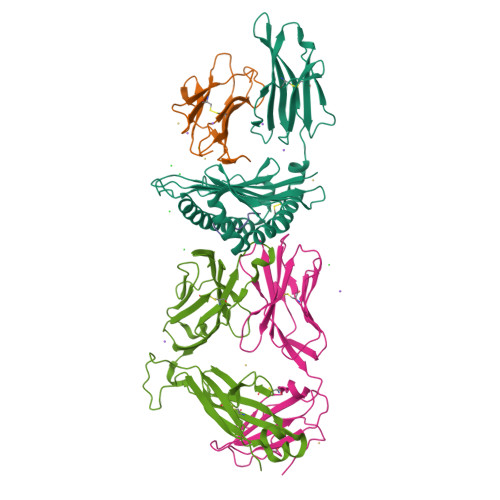
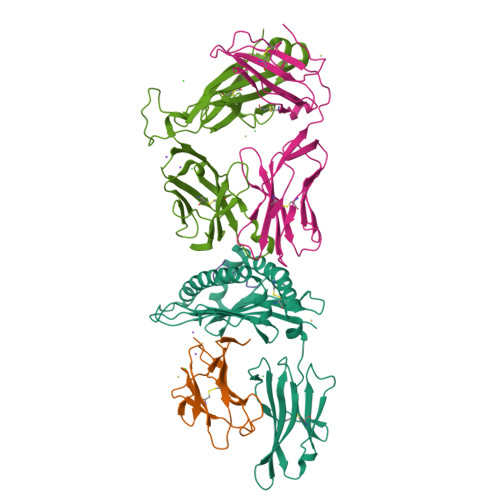
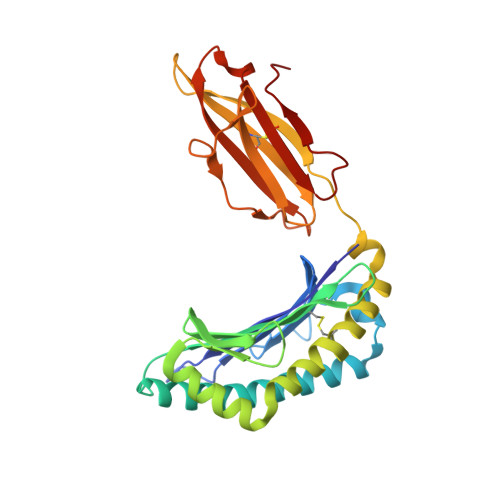
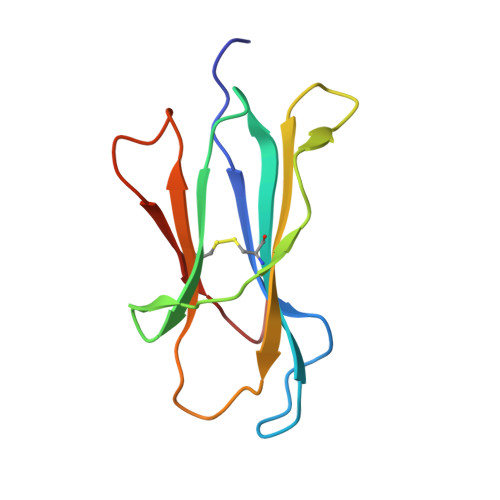
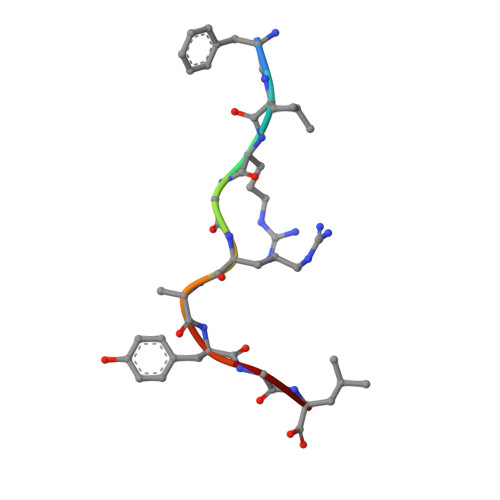
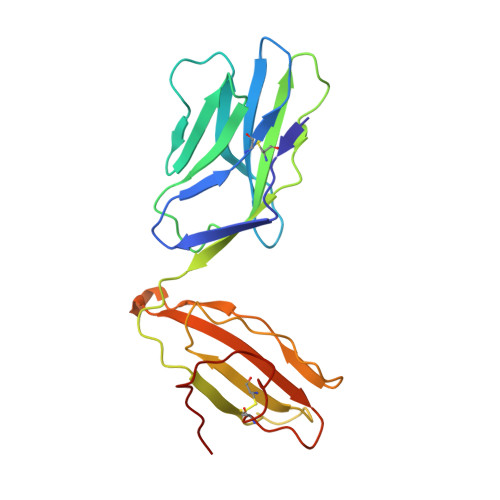
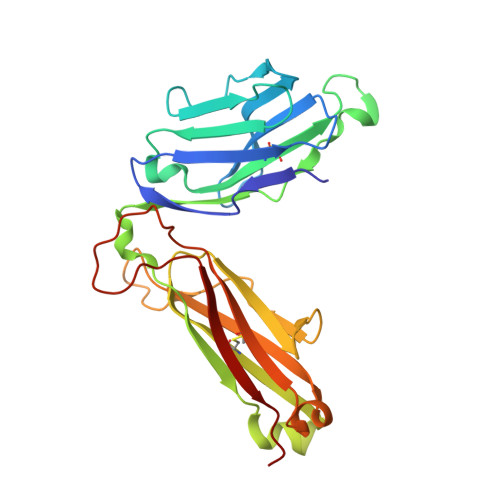
Crystal Structure of CF34 TCR in complex with HLA-B8/FLR


Experimental Data Snapshot

  • Method: X-RAY DIFFRACTION
  • Resolution: 2.80 Å
  • R-Value Free: 0.268 
  • R-Value Work: 0.221 
  • R-Value Observed: 0.223 

Starting Model: experimental
View more details

wwPDB Validation   3D Report Full Report


This is version 1.5 of the entry. See complete history


Literature

The shaping of T cell receptor recognition by self-tolerance.

Gras, S.Burrows, S.R.Kjer-Nielsen, L.Clements, C.S.Liu, Y.C.Sullivan, L.C.Bell, M.J.Brooks, A.G.Purcell, A.W.McCluskey, J.Rossjohn, J.

(2009) Immunity 30: 193-203

  • DOI: https://doi.org/10.1016/j.immuni.2008.11.011
  • Primary Citation of Related Structures:  
    3FFC

  • PubMed Abstract: 

    During selection of the T cell repertoire, the immune system navigates the subtle distinction between self-restriction and self-tolerance, yet how this is achieved is unclear. Here we describe how self-tolerance toward a trans-HLA (human leukocyte antigen) allotype shapes T cell receptor (TCR) recognition of an Epstein-Barr virus (EBV) determinant (FLRGRAYGL). The recognition of HLA-B8-FLRGRAYGL by two archetypal TCRs was compared. One was a publicly selected TCR, LC13, that is alloreactive with HLA-B44; the other, CF34, lacks HLA-B44 reactivity because it arises when HLA-B44 is coinherited in trans with HLA-B8. Whereas the alloreactive LC13 TCR docked at the C terminus of HLA-B8-FLRGRAYGL, the CF34 TCR docked at the N terminus of HLA-B8-FLRGRAYGL, which coincided with a polymorphic region between HLA-B8 and HLA-B44. The markedly contrasting footprints of the LC13 and CF34 TCRs provided a portrait of how self-tolerance shapes the specificity of TCRs selected into the immune repertoire.


  • Organizational Affiliation

    Department of Biochemistry and Molecular Biology, The Protein Crystallography Unit, Monash University, Clayton, Victoria, Australia.


Macromolecules
Find similar proteins by:  (by identity cutoff)  |  3D Structure
Entity ID: 1
MoleculeChains Sequence LengthOrganismDetailsImage
HLA class I histocompatibility antigen, B-8 alpha chain
A, F
277Homo sapiensMutation(s): 0 
Gene Names: HLA-BHLAB
UniProt & NIH Common Fund Data Resources
Find proteins for P01889 (Homo sapiens)
Explore P01889 
Go to UniProtKB:  P01889
PHAROS:  P01889
GTEx:  ENSG00000234745 
Entity Groups  
Sequence Clusters30% Identity50% Identity70% Identity90% Identity95% Identity100% Identity
UniProt GroupP01889
Sequence Annotations
Expand
  • Reference Sequence
Find similar proteins by:  (by identity cutoff)  |  3D Structure
Entity ID: 2
MoleculeChains Sequence LengthOrganismDetailsImage
Beta-2-microglobulin
B, G
100Homo sapiensMutation(s): 0 
Gene Names: B2MCDABP0092HDCMA22P
UniProt & NIH Common Fund Data Resources
Find proteins for P61769 (Homo sapiens)
Explore P61769 
Go to UniProtKB:  P61769
PHAROS:  P61769
GTEx:  ENSG00000166710 
Entity Groups  
Sequence Clusters30% Identity50% Identity70% Identity90% Identity95% Identity100% Identity
UniProt GroupP61769
Sequence Annotations
Expand
  • Reference Sequence

Find similar proteins by:  Sequence   |   3D Structure  

Entity ID: 3
MoleculeChains Sequence LengthOrganismDetailsImage
FLRGRAYGL peptide from an EBV protein
C, H
9synthetic constructMutation(s): 0 
Sequence Annotations
Expand
  • Reference Sequence
Find similar proteins by:  (by identity cutoff)  |  3D Structure
Entity ID: 4
MoleculeChains Sequence LengthOrganismDetailsImage
CF34 alpha chain
D, I
202Homo sapiensMutation(s): 0 
Entity Groups  
Sequence Clusters30% Identity50% Identity70% Identity90% Identity95% Identity100% Identity
Sequence Annotations
Expand
  • Reference Sequence
Find similar proteins by:  (by identity cutoff)  |  3D Structure
Entity ID: 5
MoleculeChains Sequence LengthOrganismDetailsImage
CF34 beta chain
E, J
247Homo sapiensMutation(s): 0 
UniProt
Find proteins for P01850 (Homo sapiens)
Explore P01850 
Go to UniProtKB:  P01850
Entity Groups  
Sequence Clusters30% Identity50% Identity70% Identity90% Identity95% Identity100% Identity
UniProt GroupP01850
Sequence Annotations
Expand
  • Reference Sequence
Small Molecules
Ligands 3 Unique
IDChains Name / Formula / InChI Key2D Diagram3D Interactions
CD
Query on CD

Download Ideal Coordinates CCD File 
BA [auth F]
DA [auth G]
EA [auth G]
IA [auth I]
JA [auth J]
BA [auth F],
DA [auth G],
EA [auth G],
IA [auth I],
JA [auth J],
K [auth A],
Q [auth B],
R [auth B],
X [auth E],
Y [auth E]
CADMIUM ION
Cd
WLZRMCYVCSSEQC-UHFFFAOYSA-N
CL
Query on CL

Download Ideal Coordinates CCD File 
AA [auth E]
CA [auth F]
FA [auth G]
L [auth A]
LA [auth J]
AA [auth E],
CA [auth F],
FA [auth G],
L [auth A],
LA [auth J],
M [auth A],
MA [auth J],
OA [auth J],
P [auth A],
S [auth B],
V [auth D]
CHLORIDE ION
Cl
VEXZGXHMUGYJMC-UHFFFAOYSA-M
NA
Query on NA

Download Ideal Coordinates CCD File 
GA [auth G]
HA [auth G]
KA [auth J]
N [auth A]
NA [auth J]
GA [auth G],
HA [auth G],
KA [auth J],
N [auth A],
NA [auth J],
O [auth A],
T [auth B],
U [auth B],
W [auth D],
Z [auth E]
SODIUM ION
Na
FKNQFGJONOIPTF-UHFFFAOYSA-N
Experimental Data & Validation

Experimental Data

  • Method: X-RAY DIFFRACTION
  • Resolution: 2.80 Å
  • R-Value Free: 0.268 
  • R-Value Work: 0.221 
  • R-Value Observed: 0.223 
  • Space Group: I 2 2 2
Unit Cell:
Length ( Å )Angle ( ˚ )
a = 111.564α = 90
b = 171.807β = 90
c = 272.69γ = 90
Software Package:
Software NamePurpose
MOSFLMdata reduction
SCALAdata scaling
PHASERphasing
REFMACrefinement
PDB_EXTRACTdata extraction

Structure Validation

View Full Validation Report


Entry History 

Deposition Data

Revision History  (Full details and data files)

  • Version 1.0: 2009-01-27
    Type: Initial release
  • Version 1.1: 2011-07-13
    Changes: Advisory, Refinement description, Version format compliance
  • Version 1.2: 2013-10-09
    Changes: Derived calculations
  • Version 1.3: 2019-11-13
    Changes: Data collection, Database references, Source and taxonomy
  • Version 1.4: 2023-11-01
    Changes: Data collection, Database references, Derived calculations, Refinement description
  • Version 1.5: 2024-10-30
    Changes: Structure summary