2GIS | pdb_00002gis

Structure of the S-adenosylmethionine riboswitch mRNA regulatory element


Experimental Data Snapshot

  • Method: X-RAY DIFFRACTION
  • Resolution: 2.90 Å
  • R-Value Free: 
    0.289 (Depositor), 0.275 (DCC) 
  • R-Value Work: 
    0.266 (Depositor), 0.250 (DCC) 
  • R-Value Observed: 
    0.266 (Depositor) 

wwPDB Validation 3D Report Full Report

Validation slider image for 2GIS

Ligand Structure Quality Assessment 


This is version 1.4 of the entry. See complete history

Literature

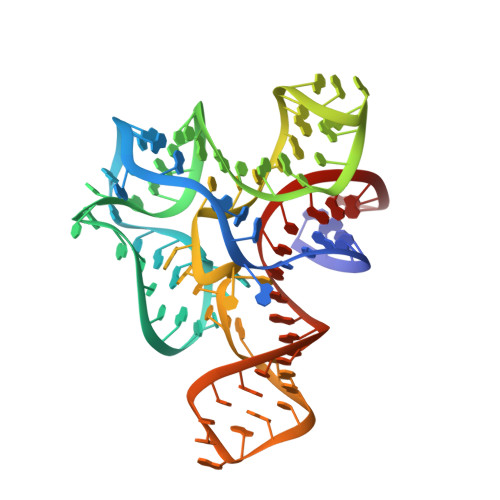
Structure of the S-adenosylmethionine riboswitch regulatory mRNA element.

Montange, R.K.Batey, R.T.

(2006) Nature 441: 1172-1175

  • DOI: https://doi.org/10.1038/nature04819
  • Primary Citation Related Structures: 
    2GIS

  • PubMed Abstract: 

    Riboswitches are cis-acting genetic regulatory elements found in the 5'-untranslated regions of messenger RNAs that control gene expression through their ability to bind small molecule metabolites directly. Regulation occurs through the interplay of two domains of the RNA: an aptamer domain that responds to intracellular metabolite concentrations and an expression platform that uses two mutually exclusive secondary structures to direct a decision-making process. In Gram-positive bacteria such as Bacillus species, riboswitches control the expression of more than 2% of all genes through their ability to respond to a diverse set of metabolites including amino acids, nucleobases and protein cofactors. Here we report the 2.9-angstroms resolution crystal structure of an S-adenosylmethionine (SAM)-responsive riboswitch from Thermoanaerobacter tengcongensis complexed with S-adenosylmethionine, an RNA element that controls the expression of several genes involved in sulphur and methionine metabolism. This RNA folds into a complex three-dimensional architecture that recognizes almost every functional group of the ligand through a combination of direct and indirect readout mechanisms. Ligand binding induces the formation of a series of tertiary interactions with one of the helices, serving as a communication link between the aptamer and expression platform domains.

Macromolecule Content 

  • Total Structure Weight: 32.18 kDa 
  • Atom Count: 2,174 
  • Modeled Residue Count: 94 
  • Deposited Residue Count: 94 
  • Unique nucleic acid chains: 1

Macromolecules

Find similar nucleic acids by:  (by identity cutoff) 
Entity ID: 1
MoleculeChains LengthOrganismImage
SAM-I riboswitch94N/A
Sequence Annotations
Expand
Reference Sequence

Small Molecules

Ligands 3 Unique
IDChains Name / Formula / InChI Key2D Diagram3D Interactions
SAM

Query on SAM


Download:Ideal Coordinates CCD File
H [auth A]S-ADENOSYLMETHIONINE
C15 H22 N6 O5 S
MEFKEPWMEQBLKI-FCKMPRQPSA-N
IRI

Query on IRI


Download:Ideal Coordinates CCD File
D [auth A],
E [auth A],
F [auth A],
G [auth A]
IRIDIUM HEXAMMINE ION
H18 Ir N6
CGMAOQLDNKCXGK-UHFFFAOYSA-N
MG

Query on MG


Download:Ideal Coordinates CCD File
B [auth A],
C [auth A]
MAGNESIUM ION
Mg
JLVVSXFLKOJNIY-UHFFFAOYSA-N

Experimental Data & Validation

Experimental Data

  • Method: X-RAY DIFFRACTION
  • Resolution: 2.90 Å
  • R-Value Free:  0.289 (Depositor), 0.275 (DCC) 
  • R-Value Work:  0.266 (Depositor), 0.250 (DCC) 
  • R-Value Observed: 0.266 (Depositor) 
Space Group: P 43 21 2
Unit Cell:
Length ( Å )Angle ( ˚ )
a = 62.901α = 90
b = 62.901β = 90
c = 158.967γ = 90
Software Package:
Software NamePurpose
CNSrefinement
BOSdata collection
d*TREKdata scaling
CNSphasing

Structure Validation

View Full Validation Report


Ligand Structure Quality Assessment 


Entry History 

Deposition Data

Revision History  (Full details and data files)

  • Version 1.0: 2006-07-04
    Type: Initial release
  • Version 1.1: 2008-05-01
    Changes: Version format compliance
  • Version 1.2: 2011-07-13
    Changes: Version format compliance
  • Version 1.3: 2017-10-18
    Changes: Refinement description
  • Version 1.4: 2024-02-14
    Changes: Data collection, Database references, Derived calculations