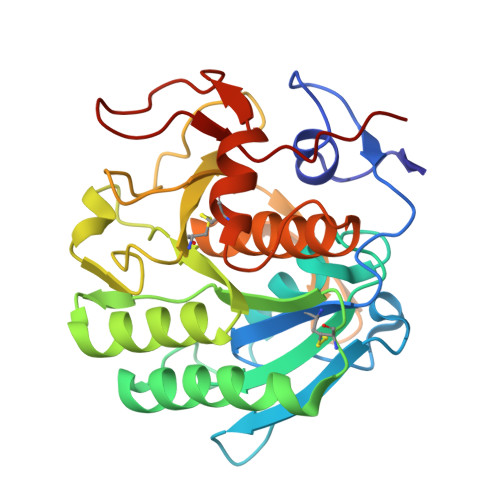
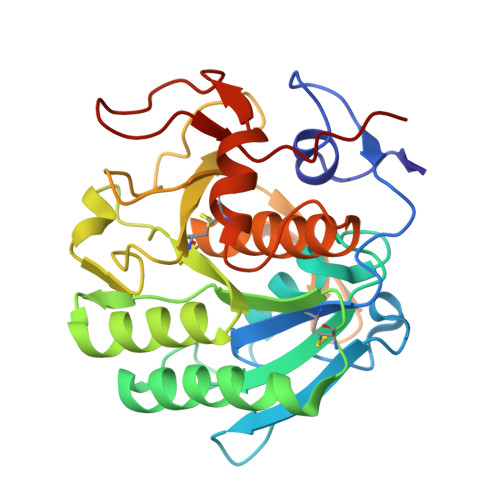
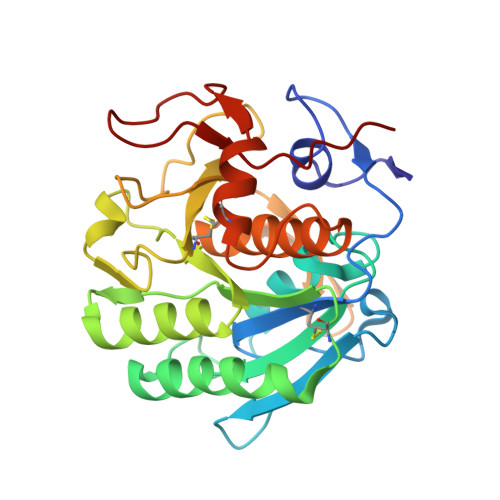
7SW7

MicroED structure of proteinase K from a 530 nm thick lamella measured at 200 kV


Experimental Data Snapshot

  • Method: ELECTRON CRYSTALLOGRAPHY
  • Resolution: 2.30 Å
  • R-Value Free: 0.242 
  • R-Value Work: 0.202 
  • R-Value Observed: 0.204 

Starting Model: experimental
View more details

wwPDB Validation   3D Report Full Report


This is version 1.2 of the entry. See complete history


Literature

Benchmarking the ideal sample thickness in cryo-EM.

Martynowycz, M.W.Clabbers, M.T.B.Unge, J.Hattne, J.Gonen, T.

(2021) Proc Natl Acad Sci U S A 118

  • DOI: https://doi.org/10.1073/pnas.2108884118
  • Primary Citation of Related Structures:  
    7SVY, 7SVZ, 7SW0, 7SW1, 7SW2, 7SW3, 7SW4, 7SW5, 7SW6, 7SW7, 7SW8, 7SW9, 7SWA, 7SWB, 7SWC

  • PubMed Abstract: 

    The relationship between sample thickness and quality of data obtained is investigated by microcrystal electron diffraction (MicroED). Several electron microscopy (EM) grids containing proteinase K microcrystals of similar sizes from the same crystallization batch were prepared. Each grid was transferred into a focused ion beam and a scanning electron microscope in which the crystals were then systematically thinned into lamellae between 95- and 1,650-nm thick. MicroED data were collected at either 120-, 200-, or 300-kV accelerating voltages. Lamellae thicknesses were expressed in multiples of the corresponding inelastic mean free path to allow the results from different acceleration voltages to be compared. The quality of the data and subsequently determined structures were assessed using standard crystallographic measures. Structures were reliably determined with similar quality from crystalline lamellae up to twice the inelastic mean free path. Lower resolution diffraction was observed at three times the mean free path for all three accelerating voltages, but the data quality was insufficient to yield structures. Finally, no coherent diffraction was observed from lamellae thicker than four times the calculated inelastic mean free path. This study benchmarks the ideal specimen thickness with implications for all cryo-EM methods.


  • Organizational Affiliation

    HHMI, University of California, Los Angeles, CA 90095.


Macromolecules
Find similar proteins by:  (by identity cutoff)  |  3D Structure
Entity ID: 1
MoleculeChains Sequence LengthOrganismDetailsImage
Proteinase K279Parengyodontium albumMutation(s): 0 
EC: 3.4.21.64
UniProt
Find proteins for P06873 (Parengyodontium album)
Explore P06873 
Go to UniProtKB:  P06873
Entity Groups  
Sequence Clusters30% Identity50% Identity70% Identity90% Identity95% Identity100% Identity
UniProt GroupP06873
Sequence Annotations
Expand
  • Reference Sequence
Experimental Data & Validation

Experimental Data

  • Method: ELECTRON CRYSTALLOGRAPHY
  • Resolution: 2.30 Å
  • R-Value Free: 0.242 
  • R-Value Work: 0.202 
  • R-Value Observed: 0.204 
  • Space Group: P 43 21 2
Unit Cell:
Length ( Å )Angle ( ˚ )
a = 67.55α = 90
b = 67.55β = 90
c = 103.09γ = 90
Software Package:
Software NamePurpose
PHENIXrefinement
XDSdata reduction
XSCALEdata scaling
PHASERphasing
EM Software:
TaskSoftware PackageVersion
RECONSTRUCTIONPHENIX
MODEL REFINEMENTPHENIX

Structure Validation

View Full Validation Report


Entry History & Funding Information

Deposition Data


Funding OrganizationLocationGrant Number
Howard Hughes Medical Institute (HHMI)United States--
National Institutes of Health/National Institute of General Medical Sciences (NIH/NIGMS)United StatesP41GM136508

Revision History  (Full details and data files)

  • Version 1.0: 2022-09-07
    Type: Initial release
  • Version 1.1: 2023-10-18
    Changes: Data collection, Refinement description
  • Version 1.2: 2024-10-23
    Changes: Data collection, Structure summary