


Crystal Structure of K8
Huang, S.X., Yan, Y.J.To be published.
Experimental Data Snapshot
Starting Model: experimental
View more details
Macromolecule Content
Entity ID: 1 | |||||
|---|---|---|---|---|---|
| Molecule | Chains | Sequence Length | Organism | Details | Image |
| chalcone synthase | 393 | Abrus precatorius | Mutation(s): 0 | 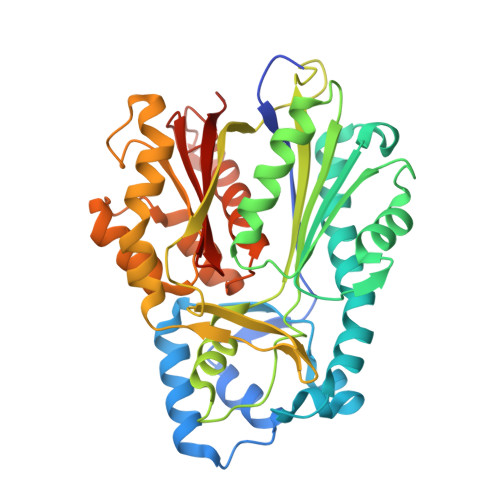 | |
| Ligands 1 Unique | |||||
|---|---|---|---|---|---|
| ID | Chains | Name / Formula / InChI Key | 2D Diagram | 3D Interactions | |
| COA Download:Ideal Coordinates CCD File | I [auth B], J [auth D], K [auth J], L | COENZYME A C21 H36 N7 O16 P3 S RGJOEKWQDUBAIZ-IBOSZNHHSA-N |  | ||
| Length ( Å ) | Angle ( ˚ ) |
|---|---|
| a = 52.151 | α = 109.735 |
| b = 117.326 | β = 90.192 |
| c = 132.878 | γ = 91.179 |
| Software Name | Purpose |
|---|---|
| REFMAC | refinement |
| HKL-3000 | data reduction |
| HKL-3000 | data scaling |
| PHASER | phasing |


