6DQG | pdb_00006dqg

Human glutamate dehydrogenase, H454Y mutant


Experimental Data Snapshot

  • Method: X-RAY DIFFRACTION
  • Resolution: 2.70 Å
  • R-Value Free: 
    0.279 (Depositor), 0.279 (DCC) 
  • R-Value Work: 
    0.241 (Depositor), 0.243 (DCC) 
  • R-Value Observed: 
    0.242 (Depositor) 

wwPDB Validation 3D Report Full Report

Validation slider image for 6DQG

This is version 1.2 of the entry. See complete history

Literature

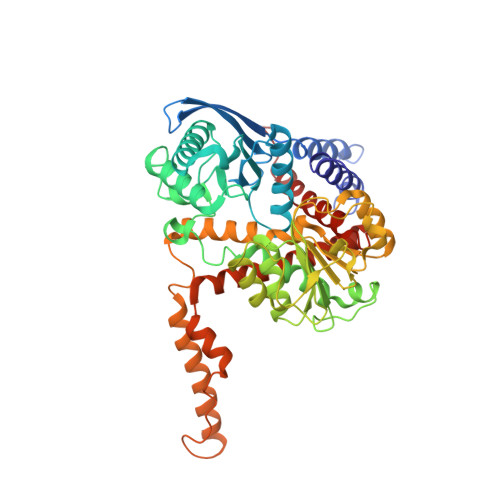
Glutamate dehydrogenase: Structure of a hyperinsulinism mutant, corrections to the atomic model, and insights into a regulatory site.

Nassar, O.M.Li, C.Stanley, C.A.Pettitt, B.M.Smith, T.J.

(2019) Proteins 87: 41-50

  • DOI: https://doi.org/10.1002/prot.25620
  • Primary Citation Related Structures: 
    6DQG

  • PubMed Abstract: 

    Mammalian glutamate dehydrogenase (GDH) has complex allosteric regulation and the loss of GTP inhibition causes the hyperinsulinism/hyperammonemia syndrome (HHS) where insulin is hypersecreted upon consumption of protein. The archetypical HHS lesion is H454Y and lies in the GTP binding pocket. To better understand the mechanism of HHS, we determined the crystal structure of H454Y. When the bovine GDH crystal structures were minimized to prepare for further computational analysis, unusually large deviations were found at the allosteric NADH binding site due to chemical sequence errors. Notably, 387 lies in an allosteric where several activators and inhibitors bind and should be lysine rather than asparagine. All structures were re-refined and the consequence of this sequence error on NADH binding was calculated using free energy perturbation. The binding free energy penalty going from the correct to incorrect sequence found is +5 kcal/mol per site and therefore has a significant impact on drug development. BROADER AUDIENCE ABSTRACT: Glutamate dehydrogenase is a key enzyme involved in amino acid catabolism. As such, it is heavily regulated in animals by a wide array of metabolites. The importance of this regulation is most apparent in a genetic disorder called hyperinsulinism/hyperammonemia (HHS) where patients hypersecrete insulin upon the consumption of protein. We determined the atomic structure of one of these HHS mutants to better understand the disease and also analyzed an allosteric regulatory site.


  • Organizational Affiliation
    • Department of Pharmacology and Toxicology, University of Texas Medical Branch, Galveston, Texas.

Macromolecule Content 

  • Total Structure Weight: 332.24 kDa 
  • Atom Count: 23,591 
  • Modeled Residue Count: 2,976 
  • Deposited Residue Count: 2,976 
  • Unique protein chains: 1

Macromolecules

Find similar proteins by:|  3D Structure
Entity ID: 1
MoleculeChains  Sequence LengthOrganismDetailsImage
Glutamate dehydrogenase 1, mitochondrial
A, B, C, D, E
A, B, C, D, E, F
496Homo sapiensMutation(s): 1 
Gene Names: GLUD1GLUD
EC: 1.4.1.3
UniProt & NIH Common Fund Data Resources
Find proteins for P00367 (Homo sapiens)
Explore P00367 
Go to UniProtKB:  P00367
PHAROS:  P00367
GTEx:  ENSG00000148672 
Entity Groups
Sequence Clusters30% Identity50% Identity70% Identity90% Identity95% Identity100% Identity
UniProt GroupP00367
Sequence Annotations
Expand
Reference Sequence

Small Molecules

Ligands 1 Unique
IDChains Name / Formula / InChI Key2D Diagram3D Interactions
PO4

Query on PO4


Download:Ideal Coordinates CCD File
G [auth A]
H [auth B]
I [auth B]
J [auth C]
K [auth C]
G [auth A],
H [auth B],
I [auth B],
J [auth C],
K [auth C],
L [auth D],
M [auth D],
N [auth D],
O [auth E],
P [auth E],
Q [auth E],
R [auth F],
S [auth F],
T [auth F],
U [auth F]
PHOSPHATE ION
O4 P
NBIIXXVUZAFLBC-UHFFFAOYSA-K

Experimental Data & Validation

Experimental Data

  • Method: X-RAY DIFFRACTION
  • Resolution: 2.70 Å
  • R-Value Free:  0.279 (Depositor), 0.279 (DCC) 
  • R-Value Work:  0.241 (Depositor), 0.243 (DCC) 
  • R-Value Observed: 0.242 (Depositor) 
Space Group: P 1
Unit Cell:
Length ( Å )Angle ( ˚ )
a = 96.803α = 85.94
b = 98.38β = 69.35
c = 124.3γ = 61
Software Package:
Software NamePurpose
HKL-2000data reduction
PHENIXrefinement
PDB_EXTRACTdata extraction
HKL-2000data scaling
PHENIXphasing

Structure Validation

View Full Validation Report


Entry History 

Deposition Data

  • Released Date: 2018-06-20 
  • Deposition Author(s): Smith, T.J.

Revision History  (Full details and data files)

  • Version 1.0: 2018-06-20
    Type: Initial release
  • Version 1.1: 2019-01-09
    Changes: Data collection, Database references
  • Version 1.2: 2024-03-13
    Changes: Data collection, Database references, Refinement description