Structure and Dynamics of FosA-Mediated Fosfomycin Resistance in Klebsiella pneumoniae and Escherichia coli.
Klontz, E.H., Tomich, A.D., Gunther, S., Lemkul, J.A., Deredge, D., Silverstein, Z., Shaw, J.F., McElheny, C., Doi, Y., Wintrode, P.L., MacKerell, A.D., Sluis-Cremer, N., Sundberg, E.J.(2017) Antimicrob Agents Chemother 61
- PubMed: 28874374 Search on PubMedSearch on PubMed Central
- DOI: https://doi.org/10.1128/AAC.01572-17
- Primary Citation Related Structures:
5V3D, 5V91, 5VB0 - PubMed Abstract:
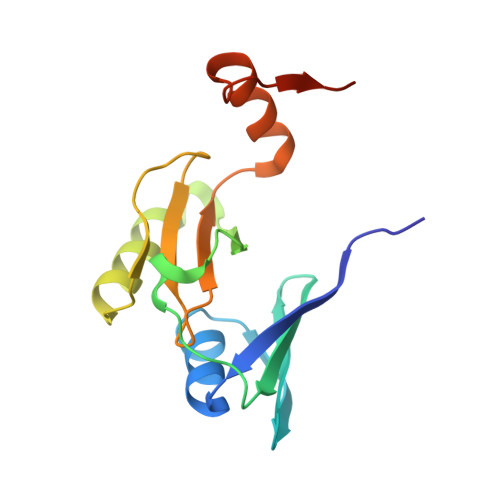
Fosfomycin exhibits broad-spectrum antibacterial activity and is being reevaluated for the treatment of extensively drug-resistant pathogens. Its activity in Gram-negative organisms, however, can be compromised by expression of FosA, a metal-dependent transferase that catalyzes the conjugation of glutathione to fosfomycin, rendering the antibiotic inactive. In this study, we solved the crystal structures of two of the most clinically relevant FosA enzymes: plasmid-encoded FosA3 from Escherichia coli and chromosomally encoded FosA from Klebsiella pneumoniae (FosA KP ). The structure, molecular dynamics, catalytic activity, and fosfomycin resistance of FosA3 and FosA KP were also compared to those of FosA from Pseudomonas aeruginosa (FosA PA ), for which prior crystal structures exist. E. coli TOP10 transformants expressing FosA3 and FosA KP conferred significantly greater fosfomycin resistance (MIC, >1,024 μg/ml) than those expressing FosA PA (MIC, 16 μg/ml), which could be explained in part by the higher catalytic efficiencies of the FosA3 and FosA KP enzymes. Interestingly, these differences in enzyme activity could not be attributed to structural differences at their active sites. Instead, molecular dynamics simulations and hydrogen-deuterium exchange experiments with FosA KP revealed dynamic interconnectivity between its active sites and a loop structure that extends from the active site of each monomer and traverses the dimer interface. This dimer interface loop is longer and more extended in FosA KP and FosA3 than in FosA PA , and kinetic analyses of FosA KP and FosA PA loop-swapped chimeric enzymes highlighted its importance in FosA activity. Collectively, these data yield novel insights into fosfomycin resistance that could be leveraged to develop new strategies to inhibit FosA and potentiate fosfomycin activity.
- Institute of Human Virology, University of Maryland School of Medicine, Baltimore, Maryland, USA.
Organizational Affiliation: