5CZV

Crystal structure of Notch3 NRR in complex with 20350 Fab


Experimental Data Snapshot

  • Method: X-RAY DIFFRACTION
  • Resolution: 3.19 Å
  • R-Value Free: 0.257 
  • R-Value Work: 0.204 
  • R-Value Observed: 0.206 

Starting Model: experimental
View more details

wwPDB Validation   3D Report Full Report


Ligand Structure Quality Assessment 


This is version 1.3 of the entry. See complete history


Literature

Characterization of activating mutations of NOTCH3 in T-cell acute lymphoblastic leukemia and anti-leukemic activity of NOTCH3 inhibitory antibodies.

Bernasconi-Elias, P.Hu, T.Jenkins, D.Firestone, B.Gans, S.Kurth, E.Capodieci, P.Deplazes-Lauber, J.Petropoulos, K.Thiel, P.Ponsel, D.Hee Choi, S.LeMotte, P.London, A.Goetcshkes, M.Nolin, E.Jones, M.D.Slocum, K.Kluk, M.J.Weinstock, D.M.Christodoulou, A.Weinberg, O.Jaehrling, J.Ettenberg, S.A.Buckler, A.Blacklow, S.C.Aster, J.C.Fryer, C.J.

(2016) Oncogene 35: 6077-6086

  • DOI: https://doi.org/10.1038/onc.2016.133
  • Primary Citation of Related Structures:  
    5CZV, 5CZX

  • PubMed Abstract: 

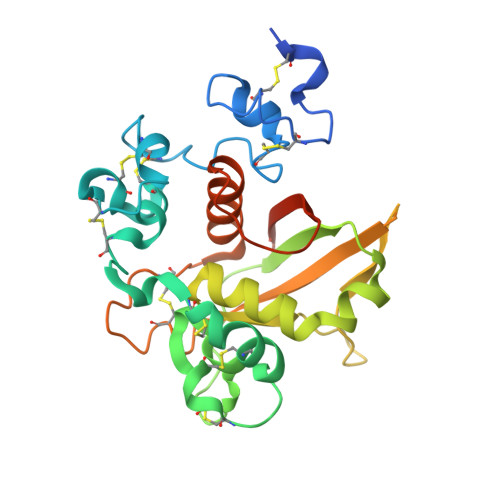
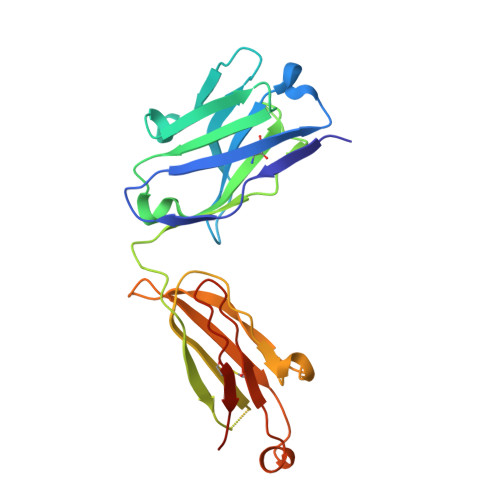
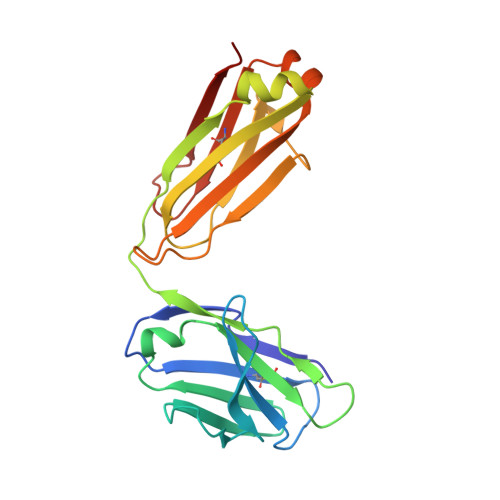
    Notch receptors have been implicated as oncogenic drivers in several cancers, the most notable example being NOTCH1 in T-cell acute lymphoblastic leukemia (T-ALL). To characterize the role of activated NOTCH3 in cancer, we generated an antibody that detects the neo-epitope created upon gamma-secretase cleavage of NOTCH3 to release its intracellular domain (ICD3), and sequenced the negative regulatory region (NRR) and PEST (proline, glutamate, serine, threonine) domain coding regions of NOTCH3 in a panel of cell lines. We also characterize NOTCH3 tumor-associated mutations that result in activation of signaling and report new inhibitory antibodies. We determined the structural basis for receptor inhibition by obtaining the first co-crystal structure of a NOTCH3 antibody with the NRR protein and defined two distinct epitopes for NRR antibodies. The antibodies exhibit potent anti-leukemic activity in cell lines and tumor xenografts harboring NOTCH3 activating mutations. Screening of primary T-ALL samples reveals that 2 of 40 tumors examined show active NOTCH3 signaling. We also identified evidence of NOTCH3 activation in 12 of 24 patient-derived orthotopic xenograft models, 2 of which exhibit activation of NOTCH3 without activation of NOTCH1. Our studies provide additional insights into NOTCH3 activation and offer a path forward for identification of cancers that are likely to respond to therapy with NOTCH3 selective inhibitory antibodies.


  • Organizational Affiliation

    Developmental and Molecular Pathways, Novartis Institutes for Biomedical Research, Cambridge, MA, USA.


Macromolecules
Find similar proteins by:  (by identity cutoff)  |  3D Structure
Entity ID: 1
MoleculeChains Sequence LengthOrganismDetailsImage
Neurogenic locus notch homolog protein 3271Homo sapiensMutation(s): 0 
Gene Names: NOTCH3
UniProt & NIH Common Fund Data Resources
Find proteins for Q9UM47 (Homo sapiens)
Explore Q9UM47 
Go to UniProtKB:  Q9UM47
GTEx:  ENSG00000074181 
Entity Groups  
Sequence Clusters30% Identity50% Identity70% Identity90% Identity95% Identity100% Identity
UniProt GroupQ9UM47
Glycosylation
Glycosylation Sites: 1Go to GlyGen: Q9UM47-1
Sequence Annotations
Expand
  • Reference Sequence
Find similar proteins by:  (by identity cutoff)  |  3D Structure
Entity ID: 2
MoleculeChains Sequence LengthOrganismDetailsImage
Fab 20350 heavy chainB [auth H]223Homo sapiensMutation(s): 0 
Entity Groups  
Sequence Clusters30% Identity50% Identity70% Identity90% Identity95% Identity100% Identity
Sequence Annotations
Expand
  • Reference Sequence
Find similar proteins by:  (by identity cutoff)  |  3D Structure
Entity ID: 3
MoleculeChains Sequence LengthOrganismDetailsImage
Fab 20350 light chainC [auth L]214Homo sapiensMutation(s): 0 
Entity Groups  
Sequence Clusters30% Identity50% Identity70% Identity90% Identity95% Identity100% Identity
Sequence Annotations
Expand
  • Reference Sequence
Experimental Data & Validation

Experimental Data

  • Method: X-RAY DIFFRACTION
  • Resolution: 3.19 Å
  • R-Value Free: 0.257 
  • R-Value Work: 0.204 
  • R-Value Observed: 0.206 
  • Space Group: C 1 2 1
Unit Cell:
Length ( Å )Angle ( ˚ )
a = 91.917α = 90
b = 104.349β = 113.17
c = 92.849γ = 90
Software Package:
Software NamePurpose
BUSTER-TNTrefinement
SCALEPACKdata scaling
PDB_EXTRACTdata extraction
BUSTERrefinement

Structure Validation

View Full Validation Report


Ligand Structure Quality Assessment 


Entry History 

Deposition Data

Revision History  (Full details and data files)

  • Version 1.0: 2016-06-01
    Type: Initial release
  • Version 1.1: 2016-12-07
    Changes: Database references
  • Version 1.2: 2020-07-29
    Type: Remediation
    Reason: Carbohydrate remediation
    Changes: Data collection, Derived calculations, Structure summary
  • Version 1.3: 2023-09-27
    Changes: Data collection, Database references, Refinement description, Structure summary