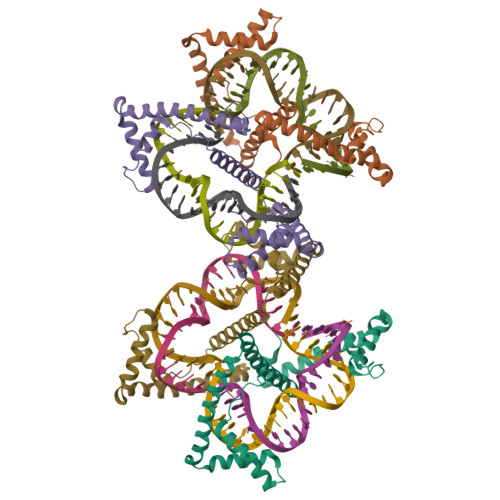
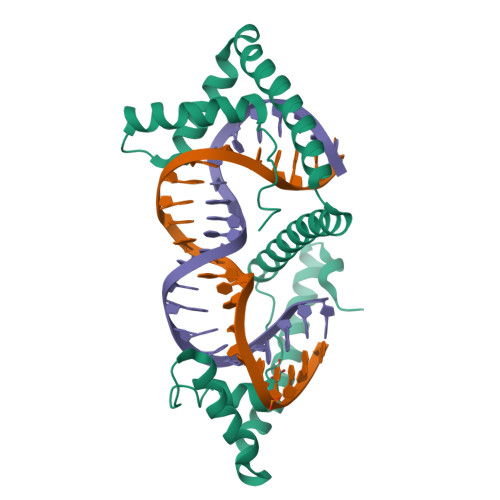
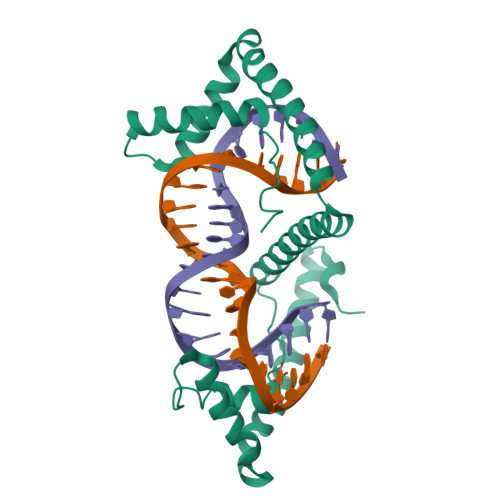
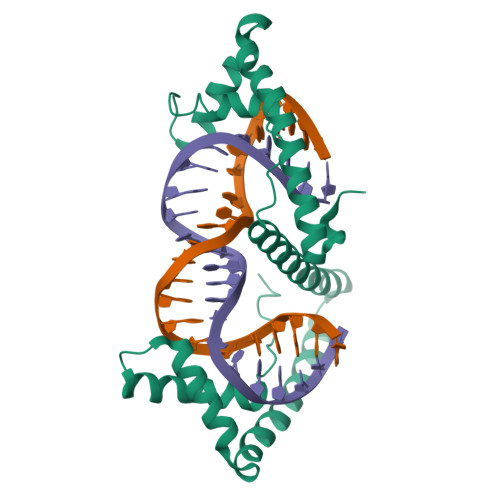
4NOD

Distinct structural features of TFAM drive mitochondrial DNA packaging versus transcriptional activation


Experimental Data Snapshot

  • Method: X-RAY DIFFRACTION
  • Resolution: 2.90 Å
  • R-Value Free: 0.267 
  • R-Value Work: 0.221 
  • R-Value Observed: 0.223 

Starting Model: experimental
View more details

wwPDB Validation   3D Report Full Report


This is version 1.2 of the entry. See complete history


Literature

Distinct structural features of TFAM drive mitochondrial DNA packaging versus transcriptional activation.

Ngo, H.B.Lovely, G.A.Phillips, R.Chan, D.C.

(2014) Nat Commun 5: 3077-3077

  • DOI: https://doi.org/10.1038/ncomms4077
  • Primary Citation of Related Structures:  
    4NNU, 4NOD

  • PubMed Abstract: 

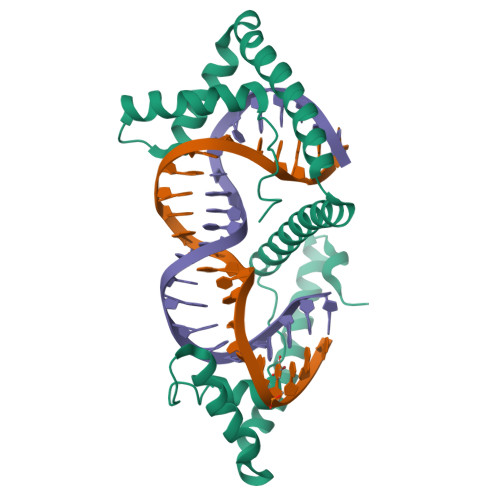
    TFAM (transcription factor A, mitochondrial) is a DNA-binding protein that activates transcription at the two major promoters of mitochondrial DNA (mtDNA)--the light strand promoter (LSP) and the heavy strand promoter 1 (HSP1). Equally important, it coats and packages the mitochondrial genome. TFAM has been shown to impose a U-turn on LSP DNA; however, whether this distortion is relevant at other sites is unknown. Here we present crystal structures of TFAM bound to HSP1 and to nonspecific DNA. In both, TFAM similarly distorts the DNA into a U-turn. Yet, TFAM binds to HSP1 in the opposite orientation from LSP explaining why transcription from LSP requires DNA bending, whereas transcription at HSP1 does not. Moreover, the crystal structures reveal dimerization of DNA-bound TFAM. This dimerization is dispensable for DNA bending and transcriptional activation but is important in DNA compaction. We propose that TFAM dimerization enhances mitochondrial DNA compaction by promoting looping of the DNA.


  • Organizational Affiliation

    1] Division of Biology and Biological Engineering, California Institute of Technology, Pasadena, California 91125, USA [2] Howard Hughes Medical Institute, California Institute of Technology, 1200 East California Boulevard, Pasadena, California 91125, USA.


Macromolecules

Find similar proteins by:  (by identity cutoff)  |  3D Structure
Entity ID: 1
MoleculeChains Sequence LengthOrganismDetailsImage
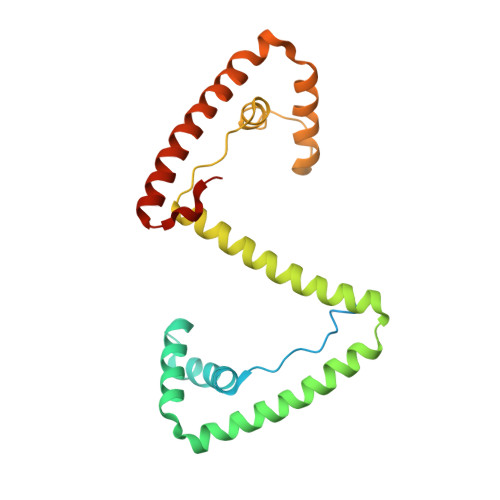
Transcription factor A, mitochondrial
A, B, G, H
230Homo sapiensMutation(s): 0 
Gene Names: TCF6TCF6L2TFAM
UniProt & NIH Common Fund Data Resources
Find proteins for Q00059 (Homo sapiens)
Explore Q00059 
Go to UniProtKB:  Q00059
PHAROS:  Q00059
GTEx:  ENSG00000108064 
Entity Groups  
Sequence Clusters30% Identity50% Identity70% Identity90% Identity95% Identity100% Identity
UniProt GroupQ00059
Sequence Annotations
Expand
  • Reference Sequence

Find similar nucleic acids by:  Sequence   |   3D Structure  

Entity ID: 2
MoleculeChains LengthOrganismImage
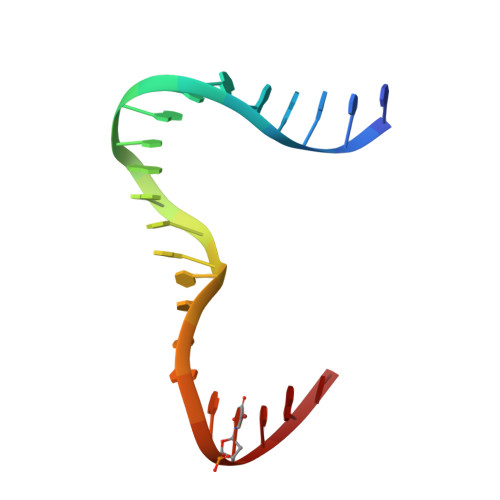
5'-D(*TP*TP*GP*GP*GP*GP*TP*AP*TP*GP*GP*GP*GP*CP*TP*TP*GP*GP*(BRU)P*TP*GP*G)-3'C,
D [auth E],
I,
J [auth K]
22Homo sapiens
Sequence Annotations
Expand
  • Reference Sequence

Find similar nucleic acids by:  Sequence   |   3D Structure  

Entity ID: 3
MoleculeChains LengthOrganismImage
5'-D(*CP*CP*AP*AP*CP*CP*AP*AP*GP*CP*CP*CP*CP*AP*TP*AP*CP*CP*CP*CP*AP*A)-3'E [auth D],
F,
K [auth J],
L
22Homo sapiens
Sequence Annotations
Expand
  • Reference Sequence
Experimental Data & Validation

Experimental Data

  • Method: X-RAY DIFFRACTION
  • Resolution: 2.90 Å
  • R-Value Free: 0.267 
  • R-Value Work: 0.221 
  • R-Value Observed: 0.223 
  • Space Group: P 1
Unit Cell:
Length ( Å )Angle ( ˚ )
a = 56.372α = 79.86
b = 82.49β = 85.48
c = 104.222γ = 84.53
Software Package:
Software NamePurpose
MAR345dtbdata collection
PHASESphasing
REFMACrefinement
MOSFLMdata reduction
SCALAdata scaling

Structure Validation

View Full Validation Report


Entry History 

Deposition Data

Revision History  (Full details and data files)

  • Version 1.0: 2014-01-22
    Type: Initial release
  • Version 1.1: 2014-02-19
    Changes: Database references
  • Version 1.2: 2023-09-20
    Changes: Data collection, Database references, Derived calculations, Refinement description