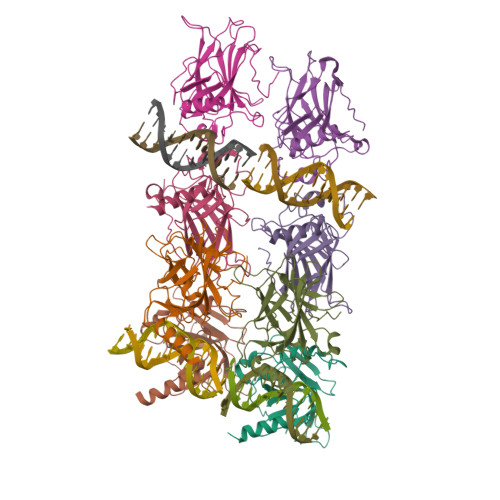
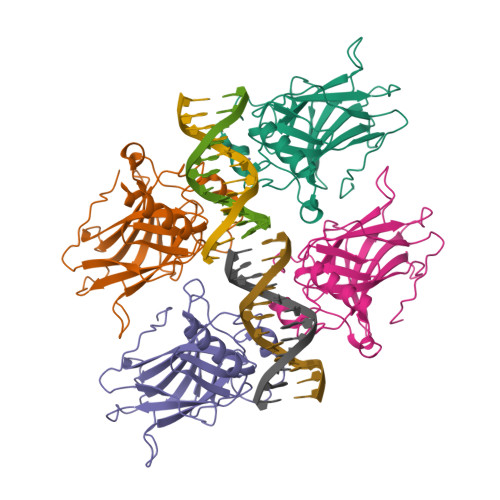
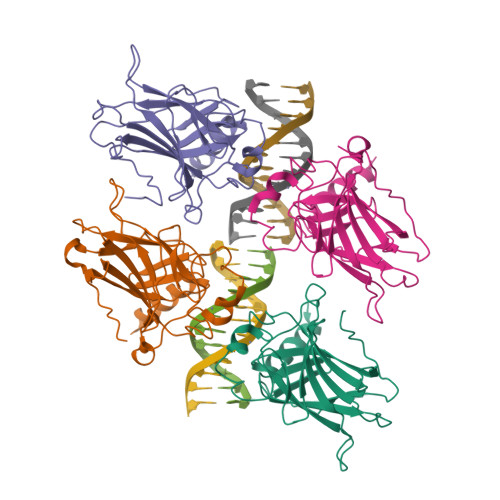
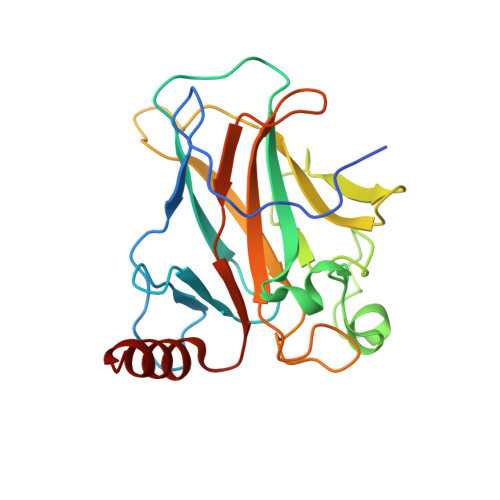
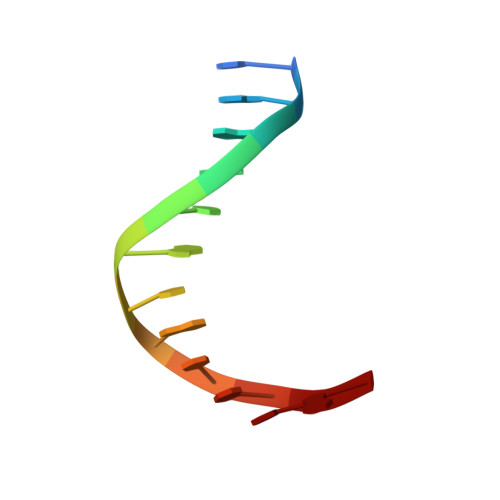
3VD1

structure of p73 DNA binding domain tetramer modulates p73 transactivation


Experimental Data Snapshot

  • Method: X-RAY DIFFRACTION
  • Resolution: 2.95 Å
  • R-Value Free: 0.285 
  • R-Value Work: 0.239 
  • R-Value Observed: 0.239 

Starting Model: experimental
View more details

wwPDB Validation   3D Report Full Report


This is version 1.3 of the entry. See complete history


Literature

Structure of p73 DNA-binding domain tetramer modulates p73 transactivation.

Ethayathulla, A.S.Tse, P.W.Monti, P.Nguyen, S.Inga, A.Fronza, G.Viadiu, H.

(2012) Proc Natl Acad Sci U S A 109: 6066-6071

  • DOI: https://doi.org/10.1073/pnas.1115463109
  • Primary Citation of Related Structures:  
    3VD0, 3VD1, 3VD2

  • PubMed Abstract: 

    The transcription factor p73 triggers developmental pathways and overlaps stress-induced p53 transcriptional pathways. How p53-family response elements determine and regulate transcriptional specificity remains an unsolved problem. In this work, we have determined the first crystal structures of p73 DNA-binding domain tetramer bound to response elements with spacers of different length. The structure and function of the adaptable tetramer are determined by the distance between two half-sites. The structures with zero and one base-pair spacers show compact p73 DNA-binding domain tetramers with large tetramerization interfaces; a two base-pair spacer results in DNA unwinding and a smaller tetramerization interface, whereas a four base-pair spacer hinders tetramerization. Functionally, p73 is more sensitive to spacer length than p53, with one base-pair spacer reducing 90% of transactivation activity and longer spacers reducing transactivation to basal levels. Our results establish the quaternary structure of the p73 DNA-binding domain required as a scaffold to promote transactivation.


  • Organizational Affiliation

    Laboratory of Structural Biochemistry, Department of Chemistry and Biochemistry, University of California at San Diego, 9500 Gilman Drive 0378, La Jolla, CA 92093, USA.


Macromolecules

Find similar proteins by:  (by identity cutoff)  |  3D Structure
Entity ID: 1
MoleculeChains Sequence LengthOrganismDetailsImage
Tumor protein p73210Homo sapiensMutation(s): 0 
UniProt & NIH Common Fund Data Resources
Find proteins for O15350 (Homo sapiens)
Explore O15350 
Go to UniProtKB:  O15350
PHAROS:  O15350
GTEx:  ENSG00000078900 
Entity Groups  
Sequence Clusters30% Identity50% Identity70% Identity90% Identity95% Identity100% Identity
UniProt GroupO15350
Sequence Annotations
Expand
  • Reference Sequence

Find similar nucleic acids by:  Sequence   |   3D Structure  

Entity ID: 2
MoleculeChains LengthOrganismImage
DNA (5'-D(*CP*GP*GP*GP*CP*AP*TP*GP*CP*CP*CP*G)-3')12N/A
Sequence Annotations
Expand
  • Reference Sequence
Experimental Data & Validation

Experimental Data

  • Method: X-RAY DIFFRACTION
  • Resolution: 2.95 Å
  • R-Value Free: 0.285 
  • R-Value Work: 0.239 
  • R-Value Observed: 0.239 
  • Space Group: P 1 21 1
Unit Cell:
Length ( Å )Angle ( ˚ )
a = 82.54α = 90
b = 104.2β = 96.55
c = 123.223γ = 90
Software Package:
Software NamePurpose
HKL-2000data collection
PHASERphasing
CNSrefinement
HKL-2000data reduction
SCALEPACKdata scaling

Structure Validation

View Full Validation Report


Entry History 

Deposition Data

Revision History  (Full details and data files)

  • Version 1.0: 2012-04-18
    Type: Initial release
  • Version 1.1: 2012-07-25
    Changes: Database references
  • Version 1.2: 2014-10-08
    Changes: Structure summary
  • Version 1.3: 2023-09-13
    Changes: Data collection, Database references, Derived calculations, Refinement description