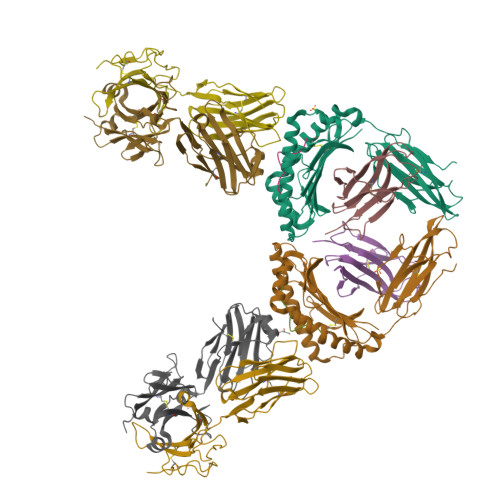
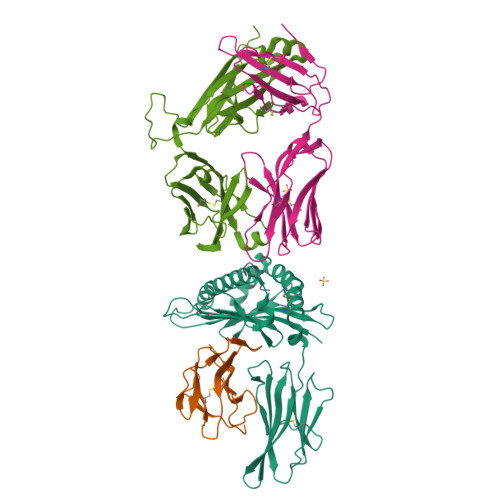
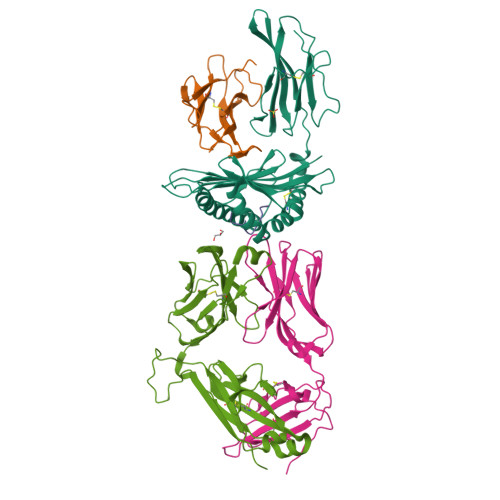
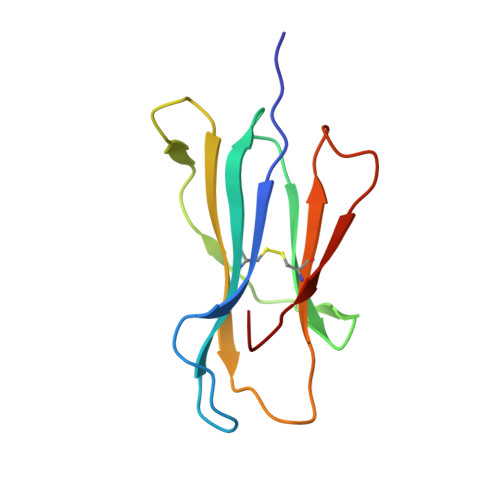
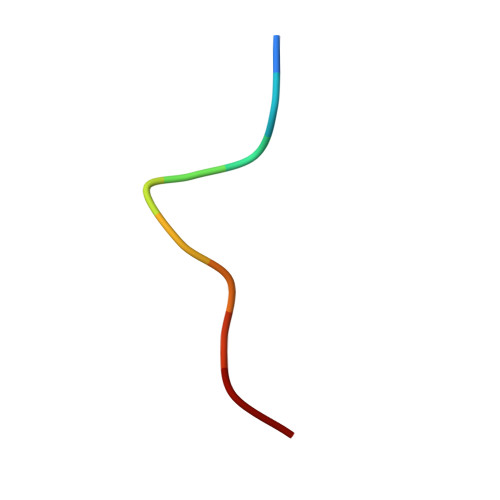
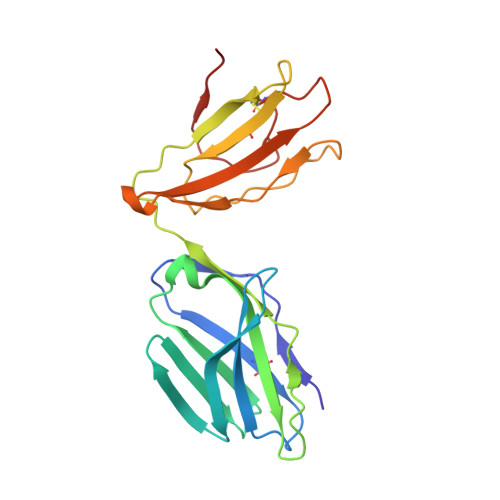
3UTS

1E6-A*0201-ALWGPDPAAA Complex, Monoclinic


Experimental Data Snapshot

  • Method: X-RAY DIFFRACTION
  • Resolution: 2.71 Å
  • R-Value Free: 0.269 
  • R-Value Work: 0.201 
  • R-Value Observed: 0.205 

wwPDB Validation   3D Report Full Report


This is version 1.2 of the entry. See complete history


Literature

Structural basis for the killing of human beta cells by CD8(+) T cells in type 1 diabetes.

Bulek, A.M.Cole, D.K.Skowera, A.Dolton, G.Gras, S.Madura, F.Fuller, A.Miles, J.J.Gostick, E.Price, D.A.Drijfhout, J.W.Knight, R.R.Huang, G.C.Lissin, N.Molloy, P.E.Wooldridge, L.Jakobsen, B.K.Rossjohn, J.Peakman, M.Rizkallah, P.J.Sewell, A.K.

(2012) Nat Immunol 13: 283-289

  • DOI: https://doi.org/10.1038/ni.2206
  • Primary Citation of Related Structures:  
    3UTP, 3UTQ, 3UTS, 3UTT

  • PubMed Abstract: 

    The structural characteristics of the engagement of major histocompatibility complex (MHC) class II-restricted self antigens by autoreactive T cell antigen receptors (TCRs) is established, but how autoimmune TCRs interact with complexes of self peptide and MHC class I has been unclear. Here we examined how CD8(+) T cells kill human islet beta cells in type 1 diabetes via recognition of a human leukocyte antigen HLA-A*0201-restricted glucose-sensitive preproinsulin peptide by the autoreactive TCR 1E6. Rigid 'lock-and-key' binding underpinned the 1E6-HLA-A*0201-peptide interaction, whereby 1E6 docked similarly to most MHC class I-restricted TCRs. However, this interaction was extraordinarily weak because of limited contacts with MHC class I. TCR binding was highly peptide centric, dominated by two residues of the complementarity-determining region 3 (CDR3) loops that acted as an 'aromatic-cap' over the complex of peptide and MHC class I (pMHCI). Thus, highly focused peptide-centric interactions associated with suboptimal TCR-pMHCI binding affinities might lead to thymic escape and potential CD8(+) T cell-mediated autoreactivity.


  • Organizational Affiliation

    Institute of Infection and Immunity, Cardiff University School of Medicine, Heath Park, Cardiff, UK.


Macromolecules
Find similar proteins by:  (by identity cutoff)  |  3D Structure
Entity ID: 1
MoleculeChains Sequence LengthOrganismDetailsImage
HLA class I histocompatibility antigen, A-2 alpha chain
A, F
276Homo sapiensMutation(s): 0 
Gene Names: HLA-AHLAA
UniProt & NIH Common Fund Data Resources
Find proteins for P04439 (Homo sapiens)
Explore P04439 
Go to UniProtKB:  P04439
PHAROS:  P04439
GTEx:  ENSG00000206503 
Entity Groups  
Sequence Clusters30% Identity50% Identity70% Identity90% Identity95% Identity100% Identity
UniProt GroupP04439
Sequence Annotations
Expand
  • Reference Sequence
Find similar proteins by:  (by identity cutoff)  |  3D Structure
Entity ID: 2
MoleculeChains Sequence LengthOrganismDetailsImage
Beta-2-microglobulin
B, G
100Homo sapiensMutation(s): 0 
Gene Names: B2MCDABP0092HDCMA22P
UniProt & NIH Common Fund Data Resources
Find proteins for P61769 (Homo sapiens)
Explore P61769 
Go to UniProtKB:  P61769
PHAROS:  P61769
GTEx:  ENSG00000166710 
Entity Groups  
Sequence Clusters30% Identity50% Identity70% Identity90% Identity95% Identity100% Identity
UniProt GroupP61769
Sequence Annotations
Expand
  • Reference Sequence

Find similar proteins by:  Sequence   |   3D Structure  

Entity ID: 3
MoleculeChains Sequence LengthOrganismDetailsImage
Insulin
C, H
10Homo sapiensMutation(s): 0 
UniProt & NIH Common Fund Data Resources
Find proteins for P01308 (Homo sapiens)
Explore P01308 
Go to UniProtKB:  P01308
PHAROS:  P01308
GTEx:  ENSG00000254647 
Entity Groups  
Sequence Clusters30% Identity50% Identity70% Identity90% Identity95% Identity100% Identity
UniProt GroupP01308
Sequence Annotations
Expand
  • Reference Sequence
Find similar proteins by:  (by identity cutoff)  |  3D Structure
Entity ID: 4
MoleculeChains Sequence LengthOrganismDetailsImage
1E6 TCR Alpha Chain
D, I
201Homo sapiensMutation(s): 0 
Entity Groups  
Sequence Clusters30% Identity50% Identity70% Identity90% Identity95% Identity100% Identity
Sequence Annotations
Expand
  • Reference Sequence
Find similar proteins by:  (by identity cutoff)  |  3D Structure
Entity ID: 5
MoleculeChains Sequence LengthOrganismDetailsImage
1E6 TCR Beta Chain
E, J
246Homo sapiensMutation(s): 0 
Entity Groups  
Sequence Clusters30% Identity50% Identity70% Identity90% Identity95% Identity100% Identity
Sequence Annotations
Expand
  • Reference Sequence
Experimental Data & Validation

Experimental Data

  • Method: X-RAY DIFFRACTION
  • Resolution: 2.71 Å
  • R-Value Free: 0.269 
  • R-Value Work: 0.201 
  • R-Value Observed: 0.205 
  • Space Group: P 1 21 1
Unit Cell:
Length ( Å )Angle ( ˚ )
a = 93.68α = 90
b = 84.59β = 90.03
c = 126.28γ = 90
Software Package:
Software NamePurpose
SCALAdata scaling
REFMACrefinement
PDB_EXTRACTdata extraction
GDAdata collection
xia2data reduction
PHASERphasing

Structure Validation

View Full Validation Report


Entry History 

Deposition Data

Revision History  (Full details and data files)

  • Version 1.0: 2012-01-25
    Type: Initial release
  • Version 1.1: 2012-03-07
    Changes: Database references
  • Version 1.2: 2024-11-20
    Changes: Data collection, Database references, Derived calculations, Structure summary