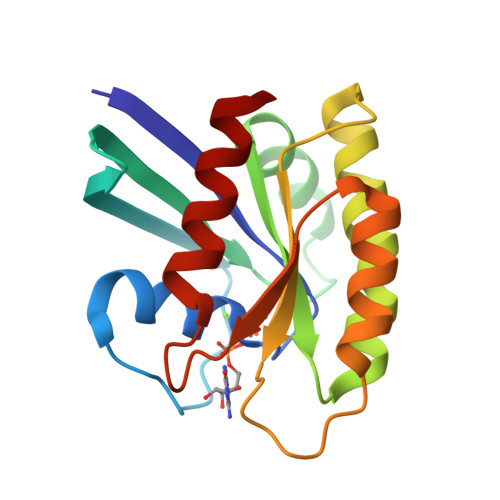
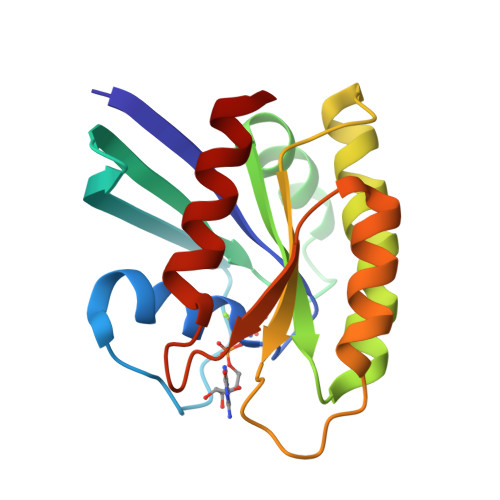
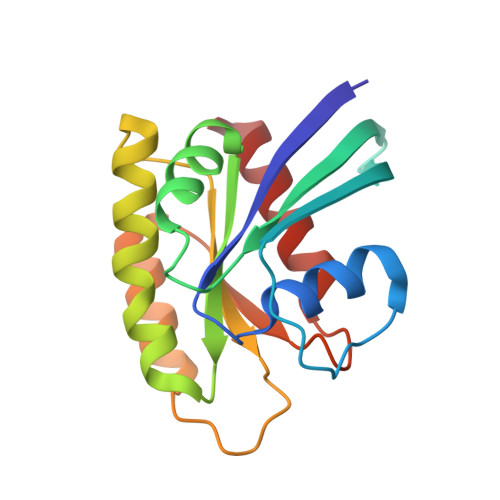
Accessing protein conformational ensembles using room-temperature X-ray crystallography.
Fraser, J.S., van den Bedem, H., Samelson, A.J., Lang, P.T., Holton, J.M., Echols, N., Alber, T.(2011) Proc Natl Acad Sci U S A 108: 16247-16252
- PubMed: 21918110
- DOI: https://doi.org/10.1073/pnas.1111325108
- Primary Citation of Related Structures:
3TGP - PubMed Abstract:
Modern protein crystal structures are based nearly exclusively on X-ray data collected at cryogenic temperatures (generally 100 K). The cooling process is thought to introduce little bias in the functional interpretation of structural results, because cryogenic temperatures minimally perturb the overall protein backbone fold. In contrast, here we show that flash cooling biases previously hidden structural ensembles in protein crystals. By analyzing available data for 30 different proteins using new computational tools for electron-density sampling, model refinement, and molecular packing analysis, we found that crystal cryocooling remodels the conformational distributions of more than 35% of side chains and eliminates packing defects necessary for functional motions. In the signaling switch protein, H-Ras, an allosteric network consistent with fluctuations detected in solution by NMR was uncovered in the room-temperature, but not the cryogenic, electron-density maps. These results expose a bias in structural databases toward smaller, overpacked, and unrealistically unique models. Monitoring room-temperature conformational ensembles by X-ray crystallography can reveal motions crucial for catalysis, ligand binding, and allosteric regulation.
Organizational Affiliation:
Department of Molecular and Cell Biology, University of California, Berkeley, CA 94720-3220, USA.


