3Q6E | pdb_00003q6e

Human insulin in complex with cucurbit[7]uril


Experimental Data Snapshot

  • Method: X-RAY DIFFRACTION
  • Resolution: 2.05 Å
  • R-Value Free: 
    0.253 (Depositor), 0.251 (DCC) 
  • R-Value Work: 
    0.206 (Depositor), 0.200 (DCC) 
  • R-Value Observed: 
    0.211 (Depositor) 

Starting Model: experimental
View more details

wwPDB Validation 3D Report Full Report

Validation slider image for 3Q6E

Ligand Structure Quality Assessment 


This is version 1.5 of the entry. See complete history

Literature

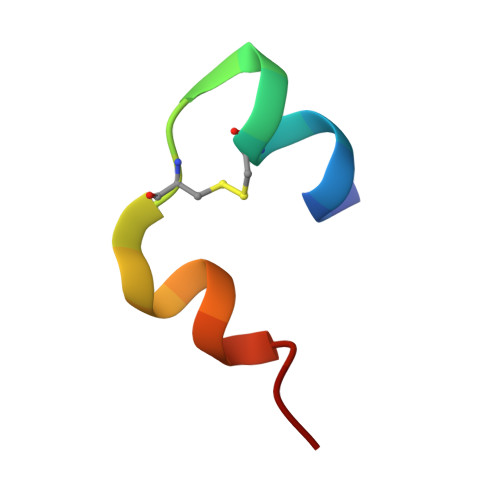
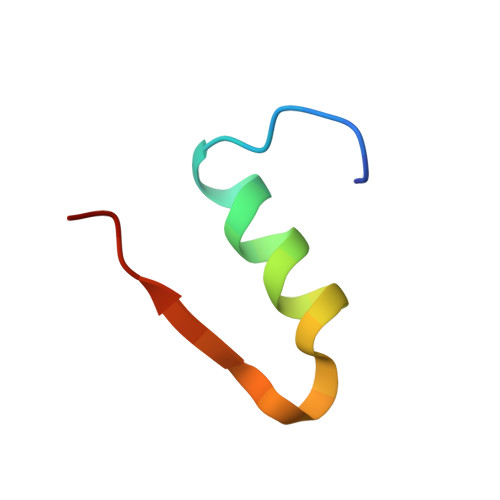
Molecular recognition of insulin by a synthetic receptor.

Chinai, J.M.Taylor, A.B.Ryno, L.M.Hargreaves, N.D.Morris, C.A.Hart, P.J.Urbach, A.R.

(2011) J Am Chem Soc 133: 8810-8813

  • DOI: https://doi.org/10.1021/ja201581x
  • Primary Citation Related Structures: 
    3Q6E

  • PubMed Abstract: 

    The discovery of molecules that bind tightly and selectively to desired proteins continues to drive innovation at the interface of chemistry and biology. This paper describes the binding of human insulin by the synthetic receptor cucurbit[7]uril (Q7) in vitro. Isothermal titration calorimetry and fluorescence spectroscopy experiments show that Q7 binds to insulin with an equilibrium association constant of 1.5 × 10(6) M(-1) and with 50-100-fold selectivity versus proteins that are much larger but lack an N-terminal aromatic residue, and with >1000-fold selectivity versus an insulin variant lacking the N-terminal phenylalanine (Phe) residue. The crystal structure of the Q7·insulin complex shows that binding occurs at the N-terminal Phe residue and that the N-terminus unfolds to enable binding. These findings suggest that site-selective recognition is based on the properties inherent to a protein terminus, including the unique chemical epitope presented by the terminal residue and the greater freedom of the terminus to unfold, like the end of a ball of string, to accommodate binding. Insulin recognition was predicted accurately from studies on short peptides and exemplifies an approach to protein recognition by targeting the terminus.


  • Organizational Affiliation
    • Department of Chemistry, Trinity University, One Trinity Place, San Antonio, Texas 78212, USA.

Macromolecule Content 

  • Total Structure Weight: 12.8 kDa 
  • Atom Count: 1,047 
  • Modeled Residue Count: 101 
  • Deposited Residue Count: 102 
  • Unique protein chains: 2

Macromolecules

Find similar proteins by:  Sequence   |   3D Structure  
Entity ID: 1
MoleculeChains  Sequence LengthOrganismDetailsImage
Insulin A chain
A, C
21Homo sapiensMutation(s): 0 
Gene Names: INS
UniProt & NIH Common Fund Data Resources
Find proteins for P01308 (Homo sapiens)
Explore P01308 
Go to UniProtKB:  P01308
PHAROS:  P01308
GTEx:  ENSG00000254647 
Entity Groups
Sequence Clusters30% Identity50% Identity70% Identity90% Identity95% Identity100% Identity
UniProt GroupP01308
Sequence Annotations
Expand
Reference Sequence
Find similar proteins by:|  3D Structure
Entity ID: 2
MoleculeChains  Sequence LengthOrganismDetailsImage
Insulin B chain
B, D
30Homo sapiensMutation(s): 0 
Gene Names: INS
UniProt & NIH Common Fund Data Resources
Find proteins for P01308 (Homo sapiens)
Explore P01308 
Go to UniProtKB:  P01308
PHAROS:  P01308
GTEx:  ENSG00000254647 
Entity Groups
Sequence Clusters30% Identity50% Identity70% Identity90% Identity95% Identity100% Identity
UniProt GroupP01308
Sequence Annotations
Expand
Reference Sequence

Small Molecules

Ligands 1 Unique
IDChains Name / Formula / InChI Key2D Diagram3D Interactions
QQ7

Query on QQ7


Download:Ideal Coordinates CCD File
E [auth D]cucurbit[7]uril
C42 H42 N28 O14
ZDOBFUIMGBWEAB-XGFHMVPTSA-N

Experimental Data & Validation

Experimental Data

  • Method: X-RAY DIFFRACTION
  • Resolution: 2.05 Å
  • R-Value Free:  0.253 (Depositor), 0.251 (DCC) 
  • R-Value Work:  0.206 (Depositor), 0.200 (DCC) 
  • R-Value Observed: 0.211 (Depositor) 
Space Group: I 41 3 2
Unit Cell:
Length ( Å )Angle ( ˚ )
a = 116.534α = 90
b = 116.534β = 90
c = 116.534γ = 90
Software Package:
Software NamePurpose
PHASERphasing
PHENIXrefinement
HKL-2000data reduction
HKL-2000data scaling

Structure Validation

View Full Validation Report


Ligand Structure Quality Assessment 


Entry History 

Deposition Data

Revision History  (Full details and data files)

  • Version 1.0: 2011-04-20
    Type: Initial release
  • Version 1.1: 2011-07-13
    Changes: Version format compliance
  • Version 1.2: 2011-11-02
    Changes: Database references
  • Version 1.3: 2014-02-19
    Changes: Other
  • Version 1.4: 2023-09-13
    Changes: Data collection, Database references, Derived calculations, Refinement description
  • Version 1.5: 2024-11-06
    Changes: Structure summary