


Formal electrostatic interactions do not govern QacR-cation affinity
Brooks, B.E., Hardie, K.M., Brown, M.H., Skurray, R.A., Brennan, R.G.To be published.
Experimental Data Snapshot
Starting Model: experimental
View more details
Entity ID: 1 | |||||
|---|---|---|---|---|---|
| Molecule | Chains | Sequence Length | Organism | Details | Image |
| HTH-type transcriptional regulator qacR | A [auth B], B [auth D], C [auth A], D [auth E] | 194 | Staphylococcus aureus | Mutation(s): 4 Gene Names: qacR | 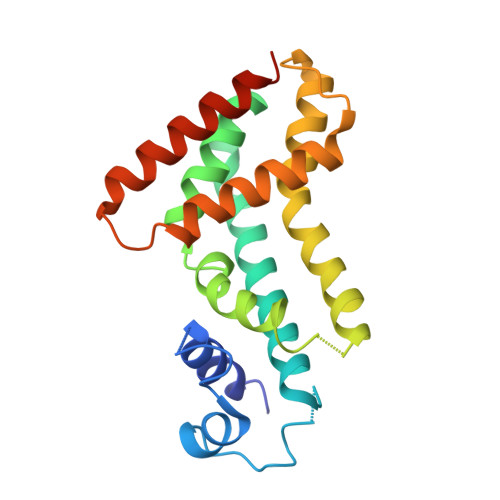 |
UniProt | |||||
Entity Groups | |||||
| Sequence Clusters | 30% Identity50% Identity70% Identity90% Identity95% Identity100% Identity | ||||
| UniProt Group | P0A0N3 | ||||
Sequence AnnotationsExpand | |||||
Reference Sequence | |||||
| Ligands 2 Unique | |||||
|---|---|---|---|---|---|
| ID | Chains | Name / Formula / InChI Key | 2D Diagram | 3D Interactions | |
| RHQ Download:Ideal Coordinates CCD File | R [auth A] | RHODAMINE 6G C28 H31 N2 O3 IWWWBRIIGAXLCJ-KRUMMXJUSA-O |  | ||
| SO4 Download:Ideal Coordinates CCD File | E [auth D] F [auth D] G [auth D] H [auth D] I [auth D] | SULFATE ION O4 S QAOWNCQODCNURD-UHFFFAOYSA-L |  | ||
| Length ( Å ) | Angle ( ˚ ) |
|---|---|
| a = 173.099 | α = 90 |
| b = 173.099 | β = 90 |
| c = 95.576 | γ = 90 |
| Software Name | Purpose |
|---|---|
| REFMAC | refinement |
| CrystalClear | data collection |
| d*TREK | data reduction |
| d*TREK | data scaling |
| MOLREP | phasing |


