2YEZ | pdb_00002yez

COMPLEX OF A B21 CHICKEN MHC CLASS I MOLECULE AND A 10MER CHICKEN PEPTIDE


Experimental Data Snapshot

  • Method: X-RAY DIFFRACTION
  • Resolution: 2.90 Å
  • R-Value Free: 
    0.273 (Depositor), 0.251 (DCC) 
  • R-Value Work: 
    0.251 (Depositor) 
  • R-Value Observed: 
    0.252 (Depositor) 

Starting Model: experimental
View more details

wwPDB Validation 3D Report Full Report

Validation slider image for 2YEZ

This is version 1.4 of the entry. See complete history

Literature

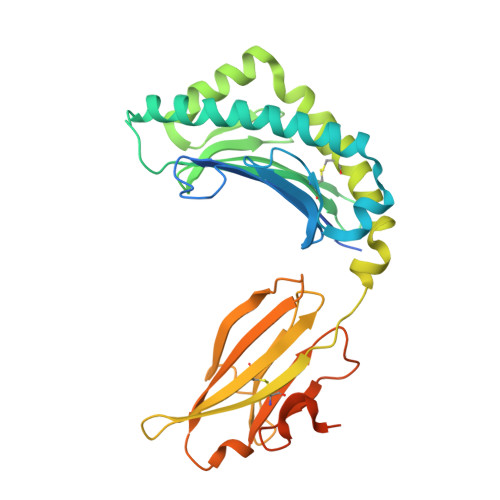
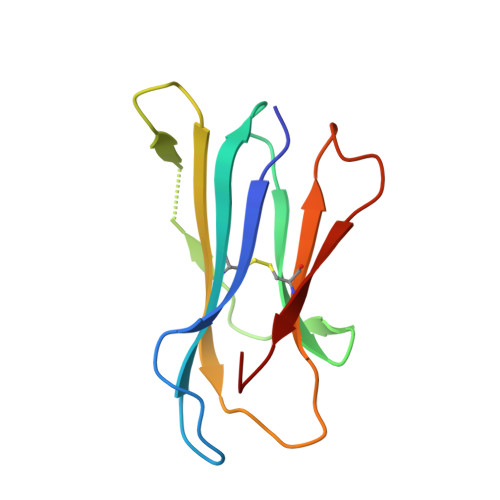
Expression levels of MHC class I molecules are inversely correlated with promiscuity of peptide binding.

Chappell, P.Meziane, e.l..K.Harrison, M.Magiera, L.Hermann, C.Mears, L.Wrobel, A.G.Durant, C.Nielsen, L.L.Buus, S.Ternette, N.Mwangi, W.Butter, C.Nair, V.Ahyee, T.Duggleby, R.Madrigal, A.Roversi, P.Lea, S.M.Kaufman, J.

(2015) Elife 4: e05345-e05345

  • DOI: https://doi.org/10.7554/eLife.05345
  • Primary Citation Related Structures: 
    2YEZ, 4CVX, 4CVZ, 4CW1, 4D0B, 4D0C, 4D0D

  • PubMed Abstract: 

    Highly polymorphic major histocompatibility complex (MHC) molecules are at the heart of adaptive immune responses, playing crucial roles in many kinds of disease and in vaccination. We report that breadth of peptide presentation and level of cell surface expression of class I molecules are inversely correlated in both chickens and humans. This relationship correlates with protective responses against infectious pathogens including Marek's disease virus leading to lethal tumours in chickens and human immunodeficiency virus infection progressing to AIDS in humans. We propose that differences in peptide binding repertoire define two groups of MHC class I molecules strategically evolved as generalists and specialists for different modes of pathogen resistance. We suggest that differences in cell surface expression level ensure the development of optimal peripheral T cell responses. The inverse relationship of peptide repertoire and expression is evidently a fundamental property of MHC molecules, with ramifications extending beyond immunology and medicine to evolutionary biology and conservation.


  • Organizational Affiliation
    • Sir William Dunn School of Pathology, University of Oxford, Oxford, United Kingdom.

Macromolecule Content 

  • Total Structure Weight: 49.12 kDa 
  • Atom Count: 3,121 
  • Modeled Residue Count: 384 
  • Deposited Residue Count: 437 
  • Unique protein chains: 3

Macromolecules

Find similar proteins by:|  3D Structure
Entity ID: 1
MoleculeChains  Sequence LengthOrganismDetailsImage
MAJOR HISTOCOMPATIBILITY COMPLEX CLASS I GLYCOPROTEIN HAPLOTYPE B21329Gallus gallusMutation(s): 0 
UniProt
Find proteins for Q95601 (Gallus gallus)
Explore Q95601 
Go to UniProtKB:  Q95601
Entity Groups
Sequence Clusters30% Identity50% Identity70% Identity90% Identity95% Identity100% Identity
UniProt GroupQ95601
Sequence Annotations
Expand
Reference Sequence
Find similar proteins by:|  3D Structure
Entity ID: 2
MoleculeChains  Sequence LengthOrganismDetailsImage
BETA-2-MICROGLOBULIN98Gallus gallusMutation(s): 0 
UniProt
Find proteins for P21611 (Gallus gallus)
Explore P21611 
Go to UniProtKB:  P21611
Entity Groups
Sequence Clusters30% Identity50% Identity70% Identity90% Identity95% Identity100% Identity
UniProt GroupP21611
Sequence Annotations
Expand
Reference Sequence
Find similar proteins by:  Sequence   |   3D Structure  
Entity ID: 3
MoleculeChains  Sequence LengthOrganismDetailsImage
14-3-3 PROTEIN THETA10Gallus gallusMutation(s): 0 
UniProt
Find proteins for Q5ZMD1 (Gallus gallus)
Explore Q5ZMD1 
Go to UniProtKB:  Q5ZMD1
Entity Groups
Sequence Clusters30% Identity50% Identity70% Identity90% Identity95% Identity100% Identity
UniProt GroupQ5ZMD1
Sequence Annotations
Expand
Reference Sequence

Experimental Data & Validation

Experimental Data

  • Method: X-RAY DIFFRACTION
  • Resolution: 2.90 Å
  • R-Value Free:  0.273 (Depositor), 0.251 (DCC) 
  • R-Value Work:  0.251 (Depositor) 
  • R-Value Observed: 0.252 (Depositor) 
Space Group: P 21 21 21
Unit Cell:
Length ( Å )Angle ( ˚ )
a = 60.57α = 90
b = 68.98β = 90
c = 94.77γ = 90
Software Package:
Software NamePurpose
BUSTERrefinement
XDSdata reduction
SCALAdata scaling
PHASERphasing

Structure Validation

View Full Validation Report


Entry History 

Deposition Data

Revision History  (Full details and data files)

  • Version 1.0: 2012-04-11
    Type: Initial release
  • Version 1.1: 2015-05-06
    Changes: Database references
  • Version 1.2: 2019-02-27
    Changes: Data collection, Database references, Other
  • Version 1.3: 2023-12-20
    Changes: Data collection, Database references, Other, Refinement description
  • Version 1.4: 2024-10-23
    Changes: Structure summary