2V1D | pdb_00002v1d

Structural basis of LSD1-CoREST selectivity in histone H3 recognition


Experimental Data Snapshot

  • Method: X-RAY DIFFRACTION
  • Resolution: 3.10 Å
  • R-Value Free: 
    0.239 (Depositor), 0.231 (DCC) 
  • R-Value Work: 
    0.223 (Depositor), 0.213 (DCC) 
  • R-Value Observed: 
    0.224 (Depositor) 

Starting Model: experimental
View more details

wwPDB Validation 3D Report Full Report

Validation slider image for 2V1D

Ligand Structure Quality Assessment 


This is version 1.3 of the entry. See complete history

Literature

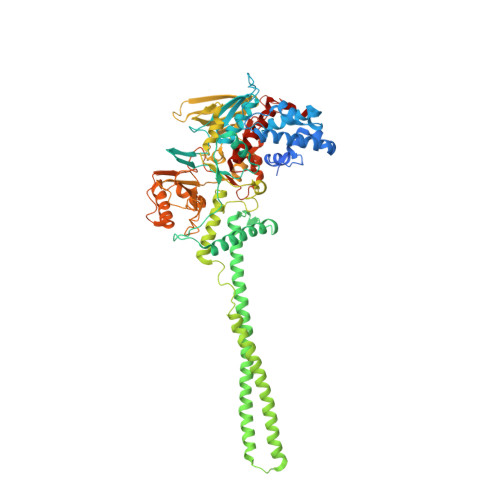
Structural Basis of Lsd1-Corest Selectivity in Histone H3 Recognition.

Forneris, F.Binda, C.Adamo, A.Battaglioli, E.Mattevi, A.

(2007) J Biological Chem 282: 20070

  • DOI: https://doi.org/10.1074/jbc.C700100200
  • Primary Citation Related Structures: 
    2V1D

  • PubMed Abstract: 

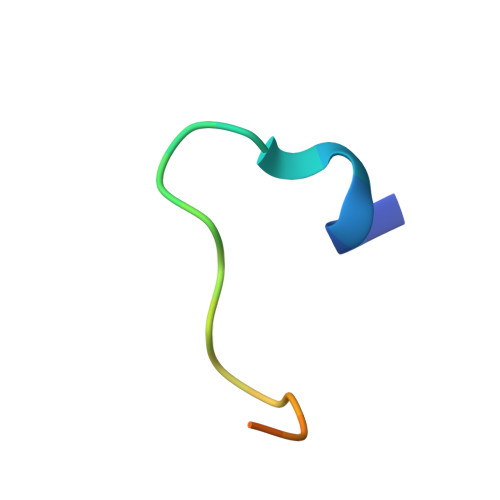
    Histone demethylase LSD1 regulates transcription by demethylating Lys(4) of histone H3. The crystal structure of the enzyme in complex with CoREST and a substrate-like peptide inhibitor highlights an intricate network of interactions and a folded conformation of the bound peptide. The core of the peptide structure is formed by Arg(2), Gln(5), and Ser(10), which are engaged in specific intramolecular H-bonds. Several charged side chains on the surface of the substrate-binding pocket establish electrostatic interactions with the peptide. The three-dimensional structure predicts that methylated Lys(4) binds in a solvent inaccessible position in front of the flavin cofactor. This geometry is fully consistent with the demethylation reaction being catalyzed through a flavin-mediated oxidation of the substrate amino-methyl group. These features dictate the exquisite substrate specificity of LSD1 and provide a structural framework to explain the fine tuning of its catalytic activity and the active role of CoREST in substrate recognition.


  • Organizational Affiliation
    • Dipartimento di Genetica e Microbiologia, Università di Pavia, Via Ferrata 1, 27100 Pavia, Italy.

Macromolecule Content 

  • Total Structure Weight: 104.57 kDa 
  • Atom Count: 6,460 
  • Modeled Residue Count: 815 
  • Deposited Residue Count: 929 
  • Unique protein chains: 3

Macromolecules

Find similar proteins by:|  3D Structure
Entity ID: 1
MoleculeChains  Sequence LengthOrganismDetailsImage
LYSINE-SPECIFIC HISTONE DEMETHYLASE 1730Homo sapiensMutation(s): 0 
EC: 1 (PDB Primary Data), 1.14.11 (UniProt), 1.14.99.66 (UniProt), 1.14.11.65 (UniProt)
UniProt & NIH Common Fund Data Resources
Find proteins for O60341 (Homo sapiens)
Explore O60341 
Go to UniProtKB:  O60341
PHAROS:  O60341
GTEx:  ENSG00000004487 
Entity Groups
Sequence Clusters30% Identity50% Identity70% Identity90% Identity95% Identity100% Identity
UniProt GroupO60341
Sequence Annotations
Expand
Reference Sequence
Find similar proteins by:|  3D Structure
Entity ID: 2
MoleculeChains  Sequence LengthOrganismDetailsImage
REST COREPRESSOR 1178Homo sapiensMutation(s): 0 
UniProt & NIH Common Fund Data Resources
Find proteins for Q9UKL0 (Homo sapiens)
Explore Q9UKL0 
Go to UniProtKB:  Q9UKL0
PHAROS:  Q9UKL0
GTEx:  ENSG00000089902 
Entity Groups
Sequence Clusters30% Identity50% Identity70% Identity90% Identity95% Identity100% Identity
UniProt GroupQ9UKL0
Sequence Annotations
Expand
Reference Sequence
Find similar proteins by:  Sequence   |   3D Structure  
Entity ID: 3
MoleculeChains  Sequence LengthOrganismDetailsImage
HISTONE H3.1T21Homo sapiensMutation(s): 1 
UniProt & NIH Common Fund Data Resources
Find proteins for Q16695 (Homo sapiens)
Explore Q16695 
Go to UniProtKB:  Q16695
PHAROS:  Q16695
GTEx:  ENSG00000168148 
Entity Groups
Sequence Clusters30% Identity50% Identity70% Identity90% Identity95% Identity100% Identity
UniProt GroupQ16695
Sequence Annotations
Expand
Reference Sequence

Small Molecules

Ligands 1 Unique
IDChains Name / Formula / InChI Key2D Diagram3D Interactions
FAD

Query on FAD


Download:Ideal Coordinates CCD File
D [auth A]FLAVIN-ADENINE DINUCLEOTIDE
C27 H33 N9 O15 P2
VWWQXMAJTJZDQX-UYBVJOGSSA-N

Experimental Data & Validation

Experimental Data

  • Method: X-RAY DIFFRACTION
  • Resolution: 3.10 Å
  • R-Value Free:  0.239 (Depositor), 0.231 (DCC) 
  • R-Value Work:  0.223 (Depositor), 0.213 (DCC) 
  • R-Value Observed: 0.224 (Depositor) 
Space Group: I 2 2 2
Unit Cell:
Length ( Å )Angle ( ˚ )
a = 120.057α = 90
b = 180.496β = 90
c = 233.387γ = 90
Software Package:
Software NamePurpose
REFMACrefinement
MOSFLMdata reduction
SCALAdata scaling
AMoREphasing

Structure Validation

View Full Validation Report


Ligand Structure Quality Assessment 


Entry History 

Deposition Data

Revision History  (Full details and data files)

  • Version 1.0: 2007-05-29
    Type: Initial release
  • Version 1.1: 2011-05-08
    Changes: Version format compliance
  • Version 1.2: 2011-07-13
    Changes: Version format compliance
  • Version 1.3: 2023-12-13
    Changes: Data collection, Database references, Derived calculations, Other, Refinement description