1TUG

Aspartate Transcarbamoylase Catalytic Chain Mutant E50A Complex with Phosphonoacetamide, Malonate, and Cytidine-5-Prime-Triphosphate (CTP)


Experimental Data Snapshot

  • Method: X-RAY DIFFRACTION
  • Resolution: 2.10 Å
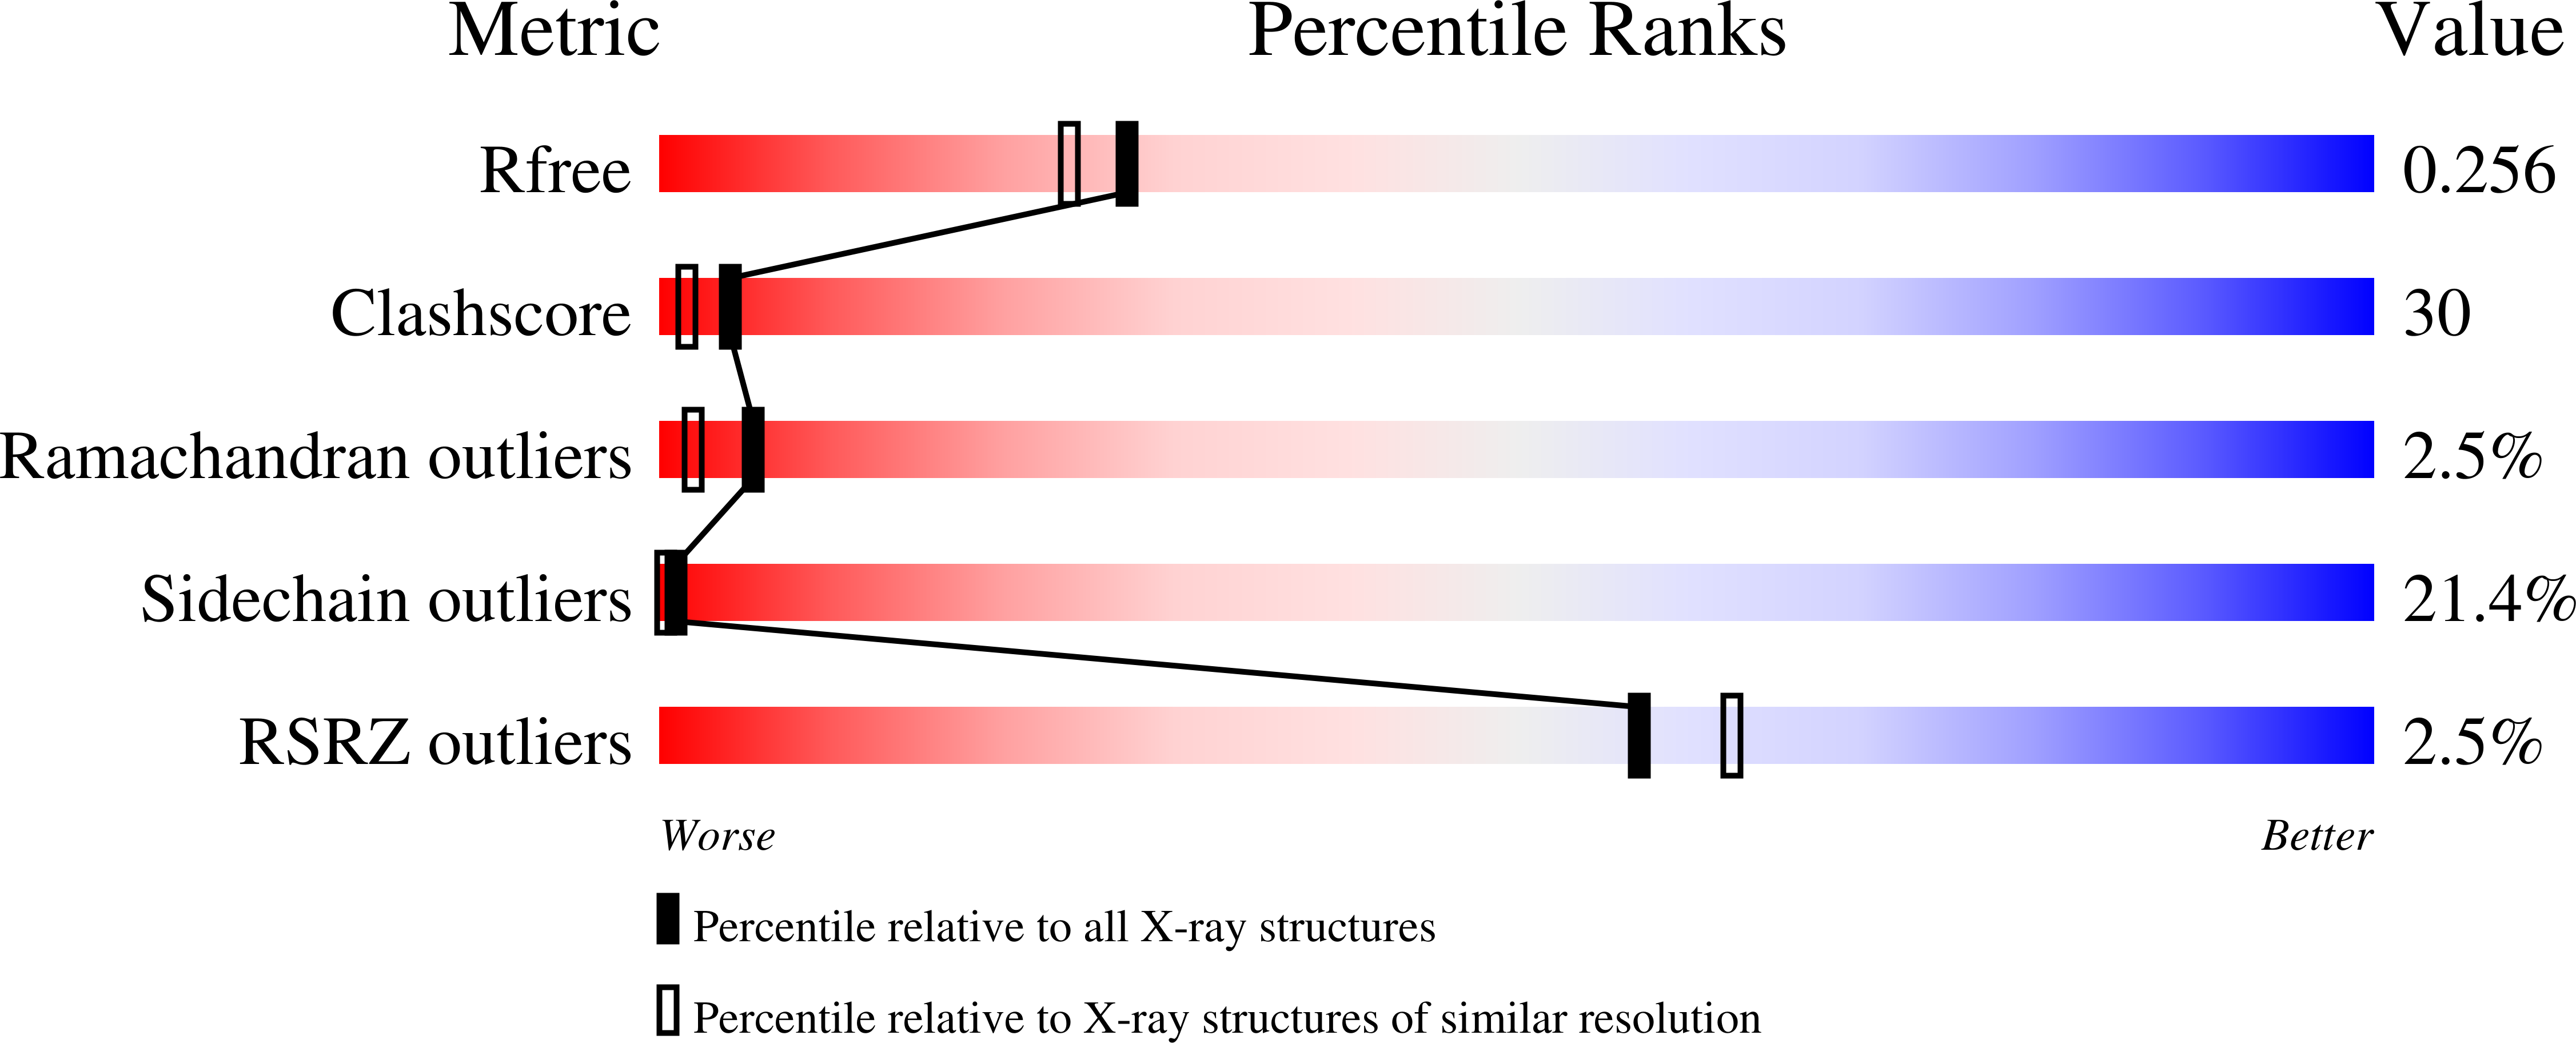
  • R-Value Free: 0.272 
  • R-Value Observed: 0.220 

Starting Model: other
View more details

wwPDB Validation   3D Report Full Report


Ligand Structure Quality Assessment 


This is version 1.5 of the entry. See complete history


Literature

Monitoring the Transition from the T to the R State in E.coli Aspartate Transcarbamoylase by X-ray Crystallography: Crystal Structures of the E50A Mutant Enzyme in Four Distinct Allosteric States.

Stieglitz, K.Stec, B.Baker, D.P.Kantrowitz, E.R.

(2004) J Mol Biol 341: 853-868

  • DOI: https://doi.org/10.1016/j.jmb.2004.06.002
  • Primary Citation of Related Structures:  
    1TTH, 1TU0, 1TUG

  • PubMed Abstract: 

    A detailed description of the transition that allosteric enzymes undergo constitutes a major challenge in structural biology. We have succeeded in trapping four distinct allosteric states of a mutant enzyme of Escherichia coli aspartate transcarbomylase and determining their structures by X-ray crystallography. The mutant version of aspartate transcarbamoylase in which Glu50 in the catalytic chains was replaced by Ala destabilizes the native R state and shifts the equilibrium towards the T state. This behavior allowed the use of substrate analogs such as phosphonoacetamide and malonate to trap the enzyme in T-like and R-like structures that are distinct from the T-state structure of the wild-type enzyme (as represented by the structure of the enzyme with CTP bound and the R-state structure as represented by the structure with N-(phosphonacetyl)-L-aspartate bound). These structures shed light on the nature and the order of internal structural rearrangements during the transition from the T to the R state. They also suggest an explanation for diminished activity of the E50A enzyme and for the change in reaction mechanism from ordered to random for this mutant enzyme.


  • Organizational Affiliation

    Department of Chemistry, Merkert Chemistry Center, Boston College, Chestnut Hill, MA 02467, USA.


Macromolecules
Find similar proteins by:  (by identity cutoff)  |  3D Structure
Entity ID: 1
MoleculeChains Sequence LengthOrganismDetailsImage
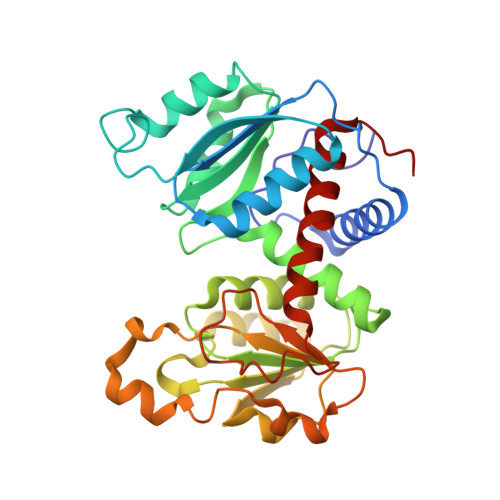
Aspartate carbamoyltransferase catalytic chain
A, C
310Escherichia coliMutation(s): 1 
Gene Names: PYRBB4245C5345Z5856ECS5222SF4245S4507
EC: 2.1.3.2
UniProt
Find proteins for P0A786 (Escherichia coli (strain K12))
Explore P0A786 
Go to UniProtKB:  P0A786
Entity Groups  
Sequence Clusters30% Identity50% Identity70% Identity90% Identity95% Identity100% Identity
UniProt GroupP0A786
Sequence Annotations
Expand
  • Reference Sequence
Find similar proteins by:  (by identity cutoff)  |  3D Structure
Entity ID: 2
MoleculeChains Sequence LengthOrganismDetailsImage
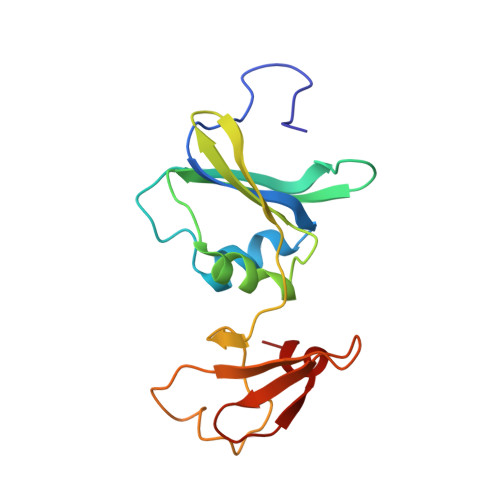
Aspartate carbamoyltransferase regulatory chain
B, D
153Escherichia coliMutation(s): 0 
Gene Names: PYRIB4244C5344Z5855ECS5221
UniProt
Find proteins for P0A7F3 (Escherichia coli (strain K12))
Explore P0A7F3 
Go to UniProtKB:  P0A7F3
Entity Groups  
Sequence Clusters30% Identity50% Identity70% Identity90% Identity95% Identity100% Identity
UniProt GroupP0A7F3
Sequence Annotations
Expand
  • Reference Sequence
Small Molecules
Ligands 4 Unique
IDChains Name / Formula / InChI Key2D Diagram3D Interactions
CTP
Query on CTP

Download Ideal Coordinates CCD File 
H [auth B],
L [auth D]
CYTIDINE-5'-TRIPHOSPHATE
C9 H16 N3 O14 P3
PCDQPRRSZKQHHS-XVFCMESISA-N
PCT
Query on PCT

Download Ideal Coordinates CCD File 
F [auth A],
J [auth C]
PHOSPHONOACETAMIDE
C2 H6 N O4 P
AKVIWWJLBFWFLM-UHFFFAOYSA-N
MLI
Query on MLI

Download Ideal Coordinates CCD File 
E [auth A],
I [auth C]
MALONATE ION
C3 H2 O4
OFOBLEOULBTSOW-UHFFFAOYSA-L
ZN
Query on ZN

Download Ideal Coordinates CCD File 
G [auth B],
K [auth D]
ZINC ION
Zn
PTFCDOFLOPIGGS-UHFFFAOYSA-N
Experimental Data & Validation

Experimental Data

  • Method: X-RAY DIFFRACTION
  • Resolution: 2.10 Å
  • R-Value Free: 0.272 
  • R-Value Observed: 0.220 
  • Space Group: P 3 2 1
Unit Cell:
Length ( Å )Angle ( ˚ )
a = 122.29α = 90
b = 122.29β = 90
c = 142.41γ = 120
Software Package:
Software NamePurpose
SHELXmodel building
SHELXL-97refinement
SDMSdata reduction
SDMSdata scaling
X-PLORphasing

Structure Validation

View Full Validation Report


Ligand Structure Quality Assessment 


Entry History 

Deposition Data

Revision History  (Full details and data files)

  • Version 1.0: 2004-07-20
    Type: Initial release
  • Version 1.1: 2008-04-30
    Changes: Version format compliance
  • Version 1.2: 2011-07-13
    Changes: Version format compliance
  • Version 1.3: 2021-10-27
    Changes: Database references, Derived calculations
  • Version 1.4: 2024-04-03
    Changes: Data collection, Refinement description
  • Version 1.5: 2024-10-30
    Changes: Structure summary