7SG1 | pdb_00007sg1

XPA5 TCR in complex with HLA-DQ2-alpha1


Experimental Data Snapshot

  • Method: X-RAY DIFFRACTION
  • Resolution: 3.10 Å
  • R-Value Free: 
    0.258 (Depositor), 0.250 (DCC) 
  • R-Value Work: 
    0.216 (Depositor), 0.220 (DCC) 
  • R-Value Observed: 
    0.219 (Depositor) 

Starting Models: experimental
View more details

wwPDB Validation   3D Report Full Report


Ligand Structure Quality Assessment 

Created with Raphaël 2.3.0Worse 01 BetterLigand structure goodness of fit to experimental dataBest fitted NAGClick on this verticalbar to view details

This is version 1.3 of the entry. See complete history


Literature

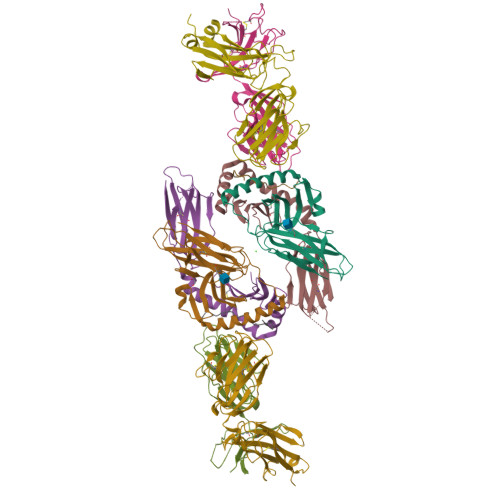
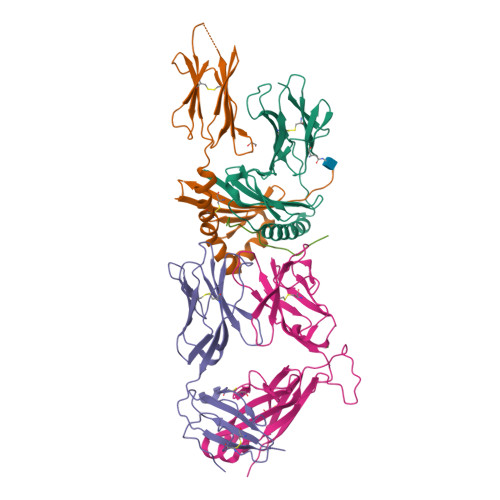
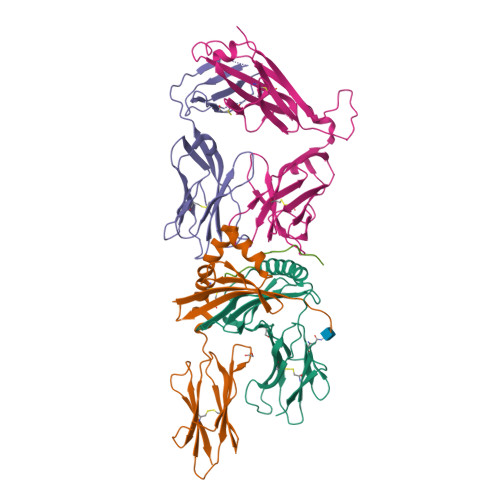
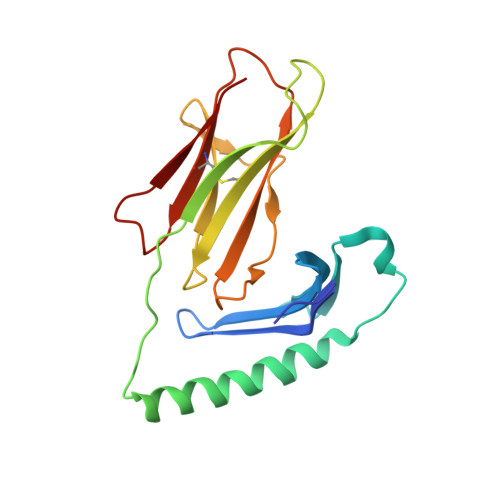
Structural basis of T cell receptor specificity and cross-reactivity of two HLA-DQ2.5-restricted gluten epitopes in celiac disease.

Ciacchi, L.Farenc, C.Dahal-Koirala, S.Petersen, J.Sollid, L.M.Reid, H.H.Rossjohn, J.

(2022) J Biological Chem 298: 101619-101619

  • DOI: https://doi.org/10.1016/j.jbc.2022.101619
  • Primary Citation of Related Structures:  
    7SG0, 7SG1, 7SG2

  • PubMed Abstract: 

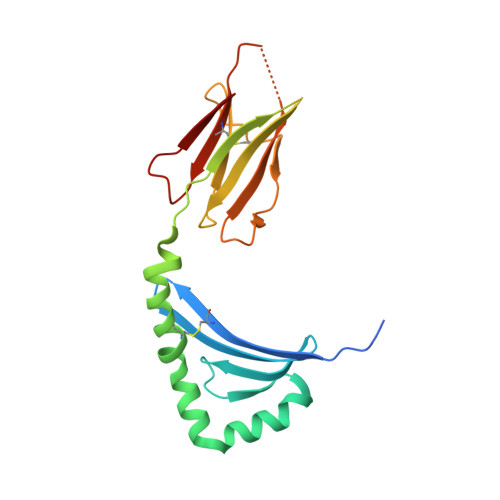
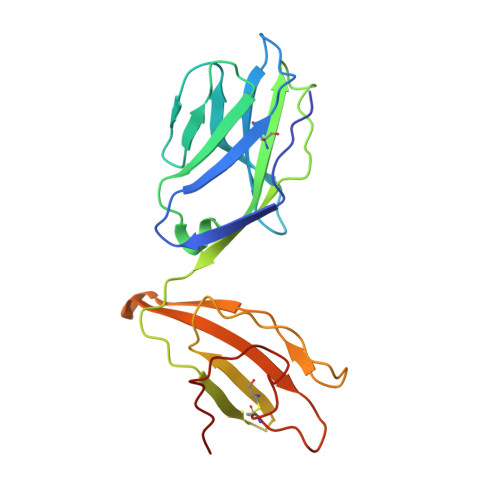
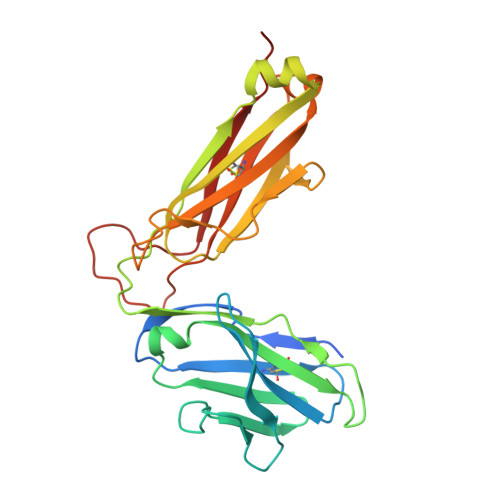
    Celiac disease is a T cell-mediated chronic inflammatory condition often characterized by human leukocyte antigen (HLA)-DQ2.5 molecules presenting gluten epitopes derived from wheat, barley, and rye. Although some T cells exhibit cross-reactivity toward distinct gluten epitopes, the structural basis underpinning such cross-reactivity is unclear. Here, we investigated the T-cell receptor specificity and cross-reactivity of two immunodominant wheat gluten epitopes, DQ2.5-glia-α1a (PFPQPELPY) and DQ2.5-glia-ω1 (PFPQPEQPF). We show by surface plasmon resonance that a T-cell receptor alpha variable (TRAV) 4 + -T-cell receptor beta variable (TRBV) 29-1 + TCR bound to HLA-DQ2.5-glia-α1a and HLA-DQ2.5-glia-ω1 with similar affinity, whereas a TRAV4 - (TRAV9-2 + ) TCR recognized HLA-DQ2.5-glia-ω1 only. We further determined the crystal structures of the TRAV4 + -TRBV29-1 + TCR bound to HLA-DQ2.5-glia-α1a and HLA-DQ2.5-glia-ω1, as well as the structure of an epitope-specific TRAV9-2 + -TRBV7-3 + TCR-HLA-DQ2.5-glia-ω1 complex. We found that position 7 (p7) of the DQ2.5-glia-α1a and DQ2.5-glia-ω1 epitopes made very limited contacts with the TRAV4 + TCR, thereby explaining the TCR cross-reactivity across these two epitopes. In contrast, within the TRAV9-2 + TCR-HLA-DQ2.5-glia-ω1 ternary complex, the p7-Gln was situated in an electrostatic pocket formed by the hypervariable CDR3β loop of the TCR and Arg70β from HLA-DQ2.5, a polar network which would not be supported by the p7-Leu residue of DQ2.5-glia-α1a. In conclusion, we provide additional insights into the molecular determinants of TCR specificity and cross-reactivity to two closely-related epitopes in celiac disease.


  • Organizational Affiliation

    Infection and Immunity Program and Department of Biochemistry and Molecular Biology, Biomedicine Discovery Institute, Monash University, Clayton, Victoria, Australia.


Macromolecules
Find similar proteins by:  (by identity cutoff)  |  3D Structure
Entity ID: 1
MoleculeChains Sequence LengthOrganismDetailsImage
HLA class II histocompatibility antigen, DQ alpha 1 chainA,
C [auth F]
183Homo sapiensMutation(s): 0 
Gene Names: HLA-DQA1
UniProt & NIH Common Fund Data Resources
Find proteins for P01909 (Homo sapiens)
Explore P01909 
Go to UniProtKB:  P01909
PHAROS:  P01909
GTEx:  ENSG00000196735 
Entity Groups  
Sequence Clusters30% Identity50% Identity70% Identity90% Identity95% Identity100% Identity
UniProt GroupP01909
Glycosylation
Glycosylation Sites: 1Go to GlyGen: P01909-1
Sequence Annotations
Expand
  • Reference Sequence
Find similar proteins by:  (by identity cutoff)  |  3D Structure
Entity ID: 2
MoleculeChains Sequence LengthOrganismDetailsImage
MHC class II HLA-DQ-beta-1B,
D [auth G]
202Homo sapiensMutation(s): 0 
Gene Names: HLA-DQB1
UniProt
Find proteins for Q5Y7D3 (Homo sapiens)
Explore Q5Y7D3 
Go to UniProtKB:  Q5Y7D3
Entity Groups  
Sequence Clusters30% Identity50% Identity70% Identity90% Identity95% Identity100% Identity
UniProt GroupQ5Y7D3
Sequence Annotations
Expand
  • Reference Sequence
Find similar proteins by:  (by identity cutoff)  |  3D Structure
Entity ID: 3
MoleculeChains Sequence LengthOrganismDetailsImage
T-cell receptor, xpa5, alpha chainE [auth D],
I
203Homo sapiensMutation(s): 0 
Entity Groups  
Sequence Clusters30% Identity50% Identity70% Identity90% Identity95% Identity100% Identity
Sequence Annotations
Expand
  • Reference Sequence
Find similar proteins by:  (by identity cutoff)  |  3D Structure
Entity ID: 4
MoleculeChains Sequence LengthOrganismDetailsImage
T-cell receptor, xpa5, beta chainF [auth E],
J
259Homo sapiensMutation(s): 0 
Entity Groups  
Sequence Clusters30% Identity50% Identity70% Identity90% Identity95% Identity100% Identity
Sequence Annotations
Expand
  • Reference Sequence

Find similar proteins by:  Sequence   |   3D Structure  

Entity ID: 5
MoleculeChains Sequence LengthOrganismDetailsImage
DQ2-glia-alpha1a peptideG [auth C],
H
16Homo sapiensMutation(s): 0 
Entity Groups  
Sequence Clusters30% Identity50% Identity70% Identity90% Identity95% Identity100% Identity
Sequence Annotations
Expand
  • Reference Sequence
Small Molecules
Ligands 3 Unique
IDChains Name / Formula / InChI Key2D Diagram3D Interactions
NAG
Query on NAG

Download Ideal Coordinates CCD File 
K [auth A],
N [auth F]
2-acetamido-2-deoxy-beta-D-glucopyranose
C8 H15 N O6
OVRNDRQMDRJTHS-FMDGEEDCSA-N
EDO
Query on EDO

Download Ideal Coordinates CCD File 
L [auth A],
O [auth F],
P [auth F]
1,2-ETHANEDIOL
C2 H6 O2
LYCAIKOWRPUZTN-UHFFFAOYSA-N
CA
Query on CA

Download Ideal Coordinates CCD File 
M [auth A],
Q [auth E]
CALCIUM ION
Ca
BHPQYMZQTOCNFJ-UHFFFAOYSA-N
Experimental Data & Validation

Experimental Data

  • Method: X-RAY DIFFRACTION
  • Resolution: 3.10 Å
  • R-Value Free:  0.258 (Depositor), 0.250 (DCC) 
  • R-Value Work:  0.216 (Depositor), 0.220 (DCC) 
  • R-Value Observed: 0.219 (Depositor) 
Space Group: C 1 2 1
Unit Cell:
Length ( Å )Angle ( ˚ )
a = 137.602α = 90
b = 75.558β = 103.76
c = 216.804γ = 90
Software Package:
Software NamePurpose
PHENIXrefinement
PDB_EXTRACTdata extraction
XDSdata reduction
SCALAdata scaling
PHASERphasing

Structure Validation

View Full Validation Report


Ligand Structure Quality Assessment 

Created with Raphaël 2.3.0Worse 01 BetterLigand structure goodness of fit to experimental dataBest fitted NAGClick on this verticalbar to view details

Entry History & Funding Information

Deposition Data


Funding OrganizationLocationGrant Number
National Health and Medical Research Council (NHMRC, Australia)Australia--

Revision History  (Full details and data files)

  • Version 1.0: 2022-02-23
    Type: Initial release
  • Version 1.1: 2023-09-13
    Changes: Data collection, Database references, Refinement description
  • Version 1.2: 2023-10-18
    Changes: Refinement description
  • Version 1.3: 2024-10-23
    Changes: Structure summary