9ODB | pdb_00009odb

Clone 2.1 Fab in complex with chicken IgY CH2 domain (local refinement)


Experimental Data Snapshot

  • Method: ELECTRON MICROSCOPY
  • Resolution: 4.00 Å
  • Aggregation State: PARTICLE 
  • Reconstruction Method: SINGLE PARTICLE 

wwPDB Validation 3D Report Full Report

Validation slider image for 9ODB

This is version 1.1 of the entry. See complete history

Literature

Replaying germinal center evolution on a quantified affinity landscape.

DeWitt, W.S.Vora, A.A.Araki, T.Galloway, J.G.Alkutkar, T.Bortolatto, J.Castro, T.B.R.Dumm, W.Jennings-Shaffer, C.Jia, T.Mesin, L.Ozorowski, G.Pae, J.Ralph, D.K.Bloom, J.D.Nourmohammad, A.Song, Y.S.Ward, A.B.Starr, T.N.Matsen, F.A.Victora, G.D.

(2025) bioRxiv 

  • DOI: https://doi.org/10.1101/2025.06.02.656870
  • Primary Citation Related Structures: 
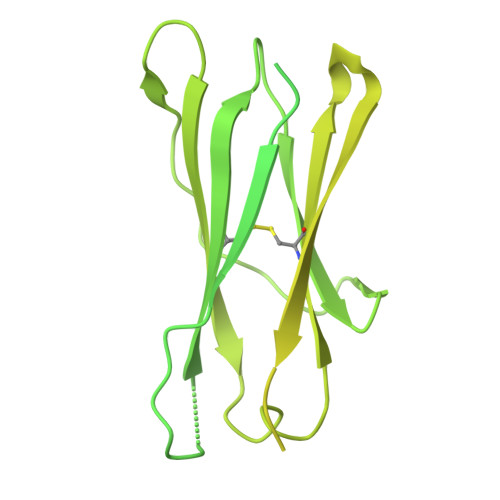
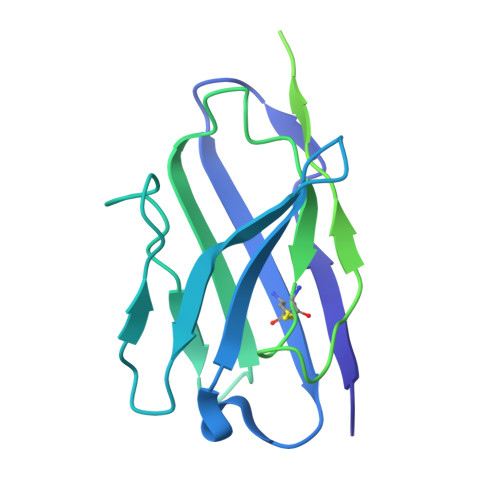
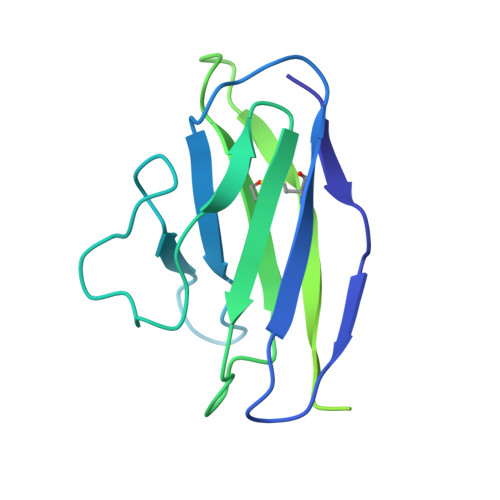
    9ODB

  • PubMed Abstract: 

    Darwinian evolution of immunoglobulin genes within germinal centers (GC) underlies the progressive increase in antibody affinity following antigen exposure. Whereas the mechanics of how competition between GC B cells drives increased affinity are well established, the dynamical evolutionary features of this process remain poorly characterized. We devised an experimental evolution model in which we "replay" over one hundred instances of a clonally homogenous GC reaction and follow the selective process by assigning affinities to all cells using deep mutational scanning. Our data reveal how GCs achieve predictable evolutionary outcomes through the cumulative effects of many rounds of imperfect selection, acting on a landscape shaped heavily by somatic hypermutation (SHM) targeting biases. Using time-calibrated models, we show that apparent features of GC evolution such as permissiveness to low-affinity lineages and early plateauing of affinity are best explained by survivorship biases that distort our view of how affinity progresses over time.

Macromolecule Content 

  • Total Structure Weight: 218.46 kDa 
  • Atom Count: 4,862 
  • Modeled Residue Count: 631 
  • Deposited Residue Count: 2,028 
  • Unique protein chains: 3

Macromolecules

Find similar proteins by:|  3D Structure
Entity ID: 1
MoleculeChains  Sequence LengthOrganismDetailsImage
chicken IgY heavy chain,Ig-like domain-containing proteinA,
F [auth D]
561Gallus gallusMutation(s): 2 
UniProt
Find proteins for A0A8V0XLK0 (Gallus gallus)
Explore A0A8V0XLK0 
Go to UniProtKB:  A0A8V0XLK0
Entity Groups
Sequence Clusters30% Identity50% Identity70% Identity90% Identity95% Identity100% Identity
UniProt GroupA0A8V0XLK0
Glycosylation
Glycosylation Sites: 1
Sequence Annotations
Expand
Reference Sequence
Find similar proteins by:|  3D Structure
Entity ID: 2
MoleculeChains  Sequence LengthOrganismDetailsImage
Clone 2.1 Fab heavy chainB [auth H],
D [auth B]
239Mus musculusMutation(s): 0 
Find similar proteins by:|  3D Structure
Entity ID: 3
MoleculeChains  Sequence LengthOrganismDetailsImage
Clone 2.1 Fab light chainC [auth L],
E [auth C]
214Mus musculusMutation(s): 0 

Experimental Data & Validation

Experimental Data

  • Method: ELECTRON MICROSCOPY
  • Resolution: 4.00 Å
  • Aggregation State: PARTICLE 
  • Reconstruction Method: SINGLE PARTICLE 
EM Software:
TaskSoftware PackageVersion
MODEL REFINEMENTPHENIX1.20.1_4487
RECONSTRUCTIONcryoSPARC

Structure Validation

View Full Validation Report


Entry History 

& Funding Information

Deposition Data


Funding OrganizationLocationGrant Number
Not funded--

Revision History  (Full details and data files)

  • Version 1.0: 2025-06-11
    Type: Initial release
  • Version 1.1: 2025-07-30
    Changes: Data collection, Database references