9N0F | pdb_00009n0f

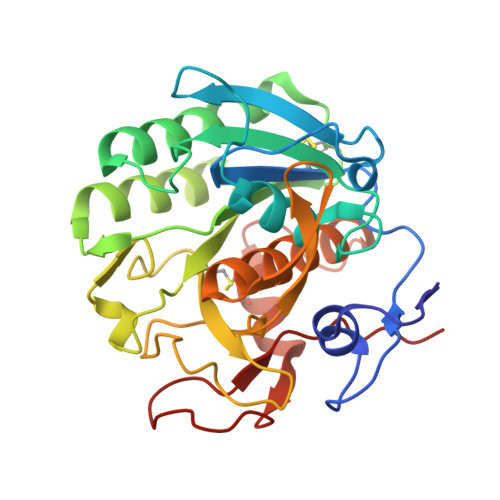
Structure of proteinase K from energy-filtered MicroED data using a 5 eV slit width


Experimental Data Snapshot

  • Method: ELECTRON CRYSTALLOGRAPHY
  • Resolution: 1.20 Å
  • R-Value Free: 
    0.170 (Depositor), 0.203 (DCC) 
  • R-Value Work: 
    0.153 (Depositor), 0.191 (DCC) 
  • R-Value Observed: 
    0.154 (Depositor) 

Starting Model: experimental
View more details

wwPDB Validation 3D Report Full Report

Validation slider image for 9N0F

This is version 1.0 of the entry. See complete history

Literature

Characterization of energy filtering slit widths for MicroED data collection.

Clabbers, M.T.B.Hattne, J.Martynowycz, M.W.Gonen, T.

(2025) bioRxiv 

  • DOI: https://doi.org/10.1101/2025.02.24.639939
  • Primary Citation Related Structures: 
    9N0F, 9N0G, 9N0H

  • PubMed Abstract: 

    A favorable signal-to-noise ratio is essential for obtaining high-quality diffraction data in macromolecular electron crystallography. Inelastic scattering contributes significantly to the noise, reducing contrast between diffraction peaks and background, which complicates peak detection and compromises the accuracy of intensity integration. Energy filtering mitigates these challenges and enhances diffraction data quality by removing the inelastically scattered electrons, leading to reduced background noise and sharper Bragg peaks. Previously, we reported a substantial improvement in MicroED data quality and resolution with energy filtering. Here, we systematically evaluate the impact of different energy filter slit widths for optimal MicroED data collection. Data from proteinase K lamellae were collected using the 5, 10, and 20 eV energy filter slit widths. Our results show that the narrowest slit widths result in a stronger diffraction signal with lower background noise, improving the precision of the intensity measurements which resulted in better structural models. Our findings provide insights into the optimization of energy filter slit settings that, when paired with direct electron detection, enhance MicroED data collection strategies in MicroED by improving the signal-to-noise ratio, supporting higher quality data and ultimately enabling more precise structure determination.


  • Organizational Affiliation
    • Howard Hughes Medical Institute, University of California, Los Angeles, CA 90095.

Macromolecule Content 

  • Total Structure Weight: 29.1 kDa 
  • Atom Count: 2,542 
  • Modeled Residue Count: 279 
  • Deposited Residue Count: 279 
  • Unique protein chains: 1

Macromolecules

Find similar proteins by:|  3D Structure
Entity ID: 1
MoleculeChains  Sequence LengthOrganismDetailsImage
Proteinase K279Parengyodontium albumMutation(s): 0 
Gene Names: PROK
EC: 3.4.21.64
UniProt
Find proteins for P06873 (Parengyodontium album)
Explore P06873 
Go to UniProtKB:  P06873
Entity Groups
Sequence Clusters30% Identity50% Identity70% Identity90% Identity95% Identity100% Identity
UniProt GroupP06873
Sequence Annotations
Expand
Reference Sequence

Experimental Data & Validation

Experimental Data

  • Method: ELECTRON CRYSTALLOGRAPHY
  • Resolution: 1.20 Å
  • R-Value Free:  0.170 (Depositor), 0.203 (DCC) 
  • R-Value Work:  0.153 (Depositor), 0.191 (DCC) 
  • R-Value Observed: 0.154 (Depositor) 
Space Group: P 43 21 2
Unit Cell:
Length ( Å )Angle ( ˚ )
a = 66.92α = 90
b = 66.92β = 90
c = 107.56γ = 90
EM Software:
TaskSoftware PackageVersion
RECONSTRUCTIONPHENIX1.21.1
MODEL REFINEMENTPHENIX1.21.1

Structure Validation

View Full Validation Report


Entry History 

& Funding Information

Deposition Data


Funding OrganizationLocationGrant Number
National Institutes of Health/National Institute of General Medical Sciences (NIH/NIGMS)United StatesP41GM136508
Department of Defense (DOD, United States)United StatesHDTRA1-21-1-0004
Howard Hughes Medical Institute (HHMI)United States--

Revision History  (Full details and data files)

  • Version 1.0: 2026-07-29
    Type: Initial release