7EZJ | pdb_00007ezj

Crystal structure of p73 DNA binding domain complex bound with 1 bp and 2 bp spacer DNA response elements.


Experimental Data Snapshot

  • Method: X-RAY DIFFRACTION
  • Resolution: 2.90 Å
  • R-Value Free: 
    0.306 (Depositor), 0.307 (DCC) 
  • R-Value Work: 
    0.241 (Depositor), 0.259 (DCC) 
  • R-Value Observed: 
    0.244 (Depositor) 

Starting Model: experimental
View more details

wwPDB Validation 3D Report Full Report

Validation slider image for 7EZJ

This is version 1.1 of the entry. See complete history

Literature

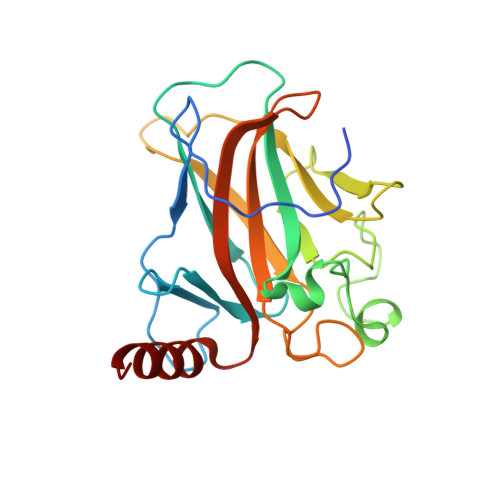
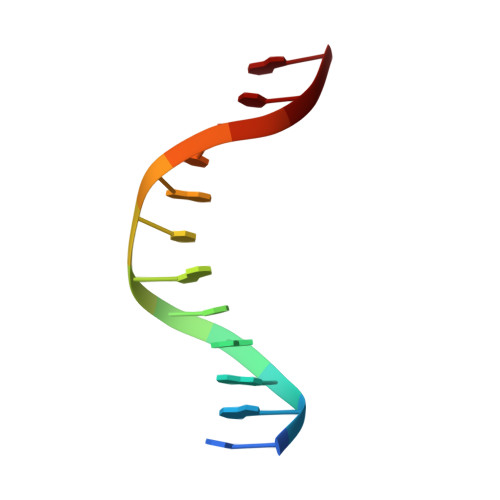
Deciphering the mechanism of p73 recognition of p53 response elements using the crystal structure of p73-DNA complexes and computational studies.

Koley, T.Roy Chowdhury, S.Kushwaha, T.Kumar, M.Inampudi, K.K.Kaur, P.Singh, T.P.Viadiu, H.Ethayathulla, A.S.

(2022) Int J Biol Macromol 206: 40-50

  • DOI: https://doi.org/10.1016/j.ijbiomac.2022.02.108
  • Primary Citation Related Structures: 
    7EZJ

  • PubMed Abstract: 

    p73 belongs to p53 family transcription factor activating more than 50% of cell fate p53 target genes involved in cell cycle, apoptosis, DNA damage response alongside neuronal system development and differentiation by binding to 20-bp response elements (REs) having sequence motif (PPPC-A/T-T/A-GYYY) where P-purines and Y-pyrimidines with each 10-bp separated by minimum 0 to 13-bp spacer. The promiscuous nature of recognizing both cell fate and development genes and the underlying RE selectivity mechanism by p73 is not well understood. Here, we report the molecular details of p73 recognizing the REs using the crystal structure of p73 DNA binding domain (DBD) in complex with 12 base pair DNA sequence 5'-cAGGCATGCCTg-3' and molecular dynamics simulations with six different p53 natural promoter sequences. Each 20-base pair natural promoter forms a different major/minor groove due to the presence of nucleotides A/T, A/C, G/G, T/T and G/T at positions 3, 8, 13, 18 uniquely recognized by p73 key residues Lys138 and Arg268. The loops L1 and L3 bearing these residues influence inter-and intra-dimer interfaces interactions and hence p73 forms a unique tetramer with each natural promoter sequence. Structural features of the DNA and the spacing between half-sites influence p73 tetramerization and its transactivation function.


  • Organizational Affiliation
    • Department of Biophysics, All India Institute of Medical Sciences, New Delhi 110029, India.

Macromolecule Content 

  • Total Structure Weight: 440.08 kDa 
  • Atom Count: 29,062 
  • Modeled Residue Count: 3,387 
  • Deposited Residue Count: 3,552 
  • Unique protein chains: 1
  • Unique nucleic acid chains: 1

Macromolecules


Find similar proteins by:|  3D Structure
Entity ID: 1
MoleculeChains  Sequence LengthOrganismDetailsImage
Tumor protein p73210Homo sapiensMutation(s): 0 
Gene Names: TP73P73
UniProt & NIH Common Fund Data Resources
Find proteins for O15350 (Homo sapiens)
Explore O15350 
Go to UniProtKB:  O15350
PHAROS:  O15350
GTEx:  ENSG00000078900 
Entity Groups
Sequence Clusters30% Identity50% Identity70% Identity90% Identity95% Identity100% Identity
UniProt GroupO15350
Sequence Annotations
Expand
Reference Sequence
Find similar nucleic acids by:  Sequence
Entity ID: 2
MoleculeChains LengthOrganismImage
12-mer DNA12Homo sapiens
Sequence Annotations
Expand
Reference Sequence

Small Molecules

Ligands 1 Unique
IDChains Name / Formula / InChI Key2D Diagram3D Interactions
ZN

Query on ZN


Download:Ideal Coordinates CCD File
GA [auth A]
HA [auth B]
IA [auth C]
JA [auth D]
KA [auth I]
GA [auth A],
HA [auth B],
IA [auth C],
JA [auth D],
KA [auth I],
LA [auth J],
MA [auth K],
NA [auth L],
OA [auth a],
PA [auth b],
QA [auth c],
RA [auth d],
SA [auth i],
TA [auth j],
UA [auth k],
VA [auth l]
ZINC ION
Zn
PTFCDOFLOPIGGS-UHFFFAOYSA-N

Experimental Data & Validation

Experimental Data

  • Method: X-RAY DIFFRACTION
  • Resolution: 2.90 Å
  • R-Value Free:  0.306 (Depositor), 0.307 (DCC) 
  • R-Value Work:  0.241 (Depositor), 0.259 (DCC) 
  • R-Value Observed: 0.244 (Depositor) 
Space Group: P 1 21 1
Unit Cell:
Length ( Å )Angle ( ˚ )
a = 139.697α = 90
b = 105.496β = 112.36
c = 155.504γ = 90
Software Package:
Software NamePurpose
PHENIXrefinement
PDB_EXTRACTdata extraction
HKL-2000data reduction
SCALEPACKdata scaling
PHASERphasing

Structure Validation

View Full Validation Report


Entry History 

Deposition Data

Revision History  (Full details and data files)

  • Version 1.0: 2022-04-13
    Type: Initial release
  • Version 1.1: 2023-11-29
    Changes: Data collection, Refinement description