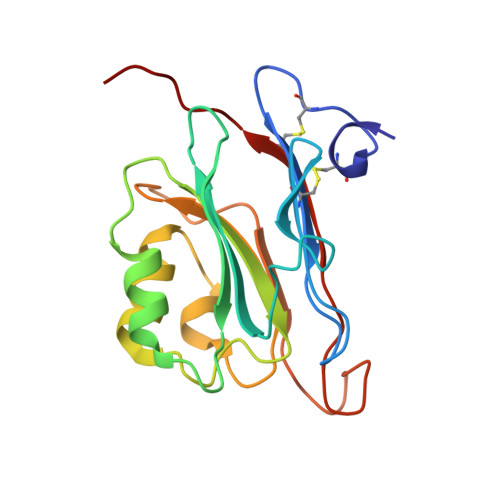
High Resolution Crystal Structure of FAM3A shed lights on its function on beta-oxidation
Chang, Z., Shi, C.To be published.
Experimental Data Snapshot
Starting Model: experimental
View more details
Entity ID: 1 | |||||
|---|---|---|---|---|---|
| Molecule | Chains | Sequence Length | Organism | Details | Image |
| Protein FAM3A | 175 | Mus musculus | Mutation(s): 0 Gene Names: Fam3a |  | |
UniProt | |||||
Find proteins for Q9D8T0 (Mus musculus) Explore Q9D8T0 Go to UniProtKB: Q9D8T0 | |||||
Entity Groups | |||||
| Sequence Clusters | 30% Identity50% Identity70% Identity90% Identity95% Identity100% Identity | ||||
| UniProt Group | Q9D8T0 | ||||
Sequence AnnotationsExpand | |||||
| |||||
| Ligands 2 Unique | |||||
|---|---|---|---|---|---|
| ID | Chains | Name / Formula / InChI Key | 2D Diagram | 3D Interactions | |
| J0R (Subject of Investigation/LOI) Query on J0R | B [auth A] | [(2R)-1-(trimethyl-$l^4-azanyl)propan-2-yl] ethanoate C8 H18 N O2 TXPWCDJHFBRHES-SSDOTTSWSA-N |  | ||
| SO4 Query on SO4 | C [auth A] | SULFATE ION O4 S QAOWNCQODCNURD-UHFFFAOYSA-L |  | ||
| Length ( Å ) | Angle ( ˚ ) |
|---|---|
| a = 40.186 | α = 90 |
| b = 60.782 | β = 90 |
| c = 78.907 | γ = 90 |
| Software Name | Purpose |
|---|---|
| HKL-2000 | data scaling |
| PHENIX | refinement |
| PDB_EXTRACT | data extraction |
| Adxv | data reduction |
| MOLREP | phasing |