6RPB

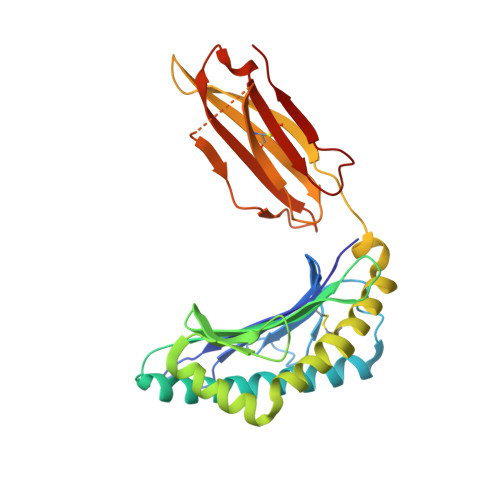
Crystal structure of the T-cell receptor NYE_S1 bound to HLA A2*01-SLLMWITQV


Experimental Data Snapshot

  • Method: X-RAY DIFFRACTION
  • Resolution: 2.50 Å
  • R-Value Free: 0.273 
  • R-Value Work: 0.249 
  • R-Value Observed: 0.250 

Starting Models: experimental
View more details

wwPDB Validation   3D Report Full Report


This is version 1.3 of the entry. See complete history


Literature

TCRs with Distinct Specificity Profiles Use Different Binding Modes to Engage an Identical Peptide-HLA Complex.

Coles, C.H.Mulvaney, R.M.Malla, S.Walker, A.Smith, K.J.Lloyd, A.Lowe, K.L.McCully, M.L.Martinez Hague, R.Aleksic, M.Harper, J.Paston, S.J.Donnellan, Z.Chester, F.Wiederhold, K.Robinson, R.A.Knox, A.Stacey, A.R.Dukes, J.Baston, E.Griffin, S.Jakobsen, B.K.Vuidepot, A.Harper, S.

(2020) J Immunol 204: 1943-1953

  • DOI: https://doi.org/10.4049/jimmunol.1900915
  • Primary Citation of Related Structures:  
    6RP9, 6RPA, 6RPB

  • PubMed Abstract: 

    The molecular rules driving TCR cross-reactivity are poorly understood and, consequently, it is unclear the extent to which TCRs targeting the same Ag recognize the same off-target peptides. We determined TCR-peptide-HLA crystal structures and, using a single-chain peptide-HLA phage library, we generated peptide specificity profiles for three newly identified human TCRs specific for the cancer testis Ag NY-ESO-1 157-165 -HLA-A2. Two TCRs engaged the same central peptide feature, although were more permissive at peripheral peptide positions and, accordingly, possessed partially overlapping peptide specificity profiles. The third TCR engaged a flipped peptide conformation, leading to the recognition of off-target peptides sharing little similarity with the cognate peptide. These data show that TCRs specific for a cognate peptide recognize discrete peptide repertoires and reconciles how an individual's limited TCR repertoire following negative selection in the thymus is able to recognize a vastly larger antigenic pool.


  • Organizational Affiliation

    Immunocore, Ltd., Abingdon, Oxfordshire OX14 4RY, United Kingdom; and.


Macromolecules
Find similar proteins by:  (by identity cutoff)  |  3D Structure
Entity ID: 1
MoleculeChains Sequence LengthOrganismDetailsImage
HLA class I histocompatibility antigen, A-2 alpha chain
A, F, K, P
277Homo sapiensMutation(s): 0 
Gene Names: HLA-AHLAA
UniProt & NIH Common Fund Data Resources
Find proteins for P04439 (Homo sapiens)
Explore P04439 
Go to UniProtKB:  P04439
PHAROS:  P04439
GTEx:  ENSG00000206503 
Entity Groups  
Sequence Clusters30% Identity50% Identity70% Identity90% Identity95% Identity100% Identity
UniProt GroupP04439
Sequence Annotations
Expand
  • Reference Sequence
Find similar proteins by:  (by identity cutoff)  |  3D Structure
Entity ID: 2
MoleculeChains Sequence LengthOrganismDetailsImage
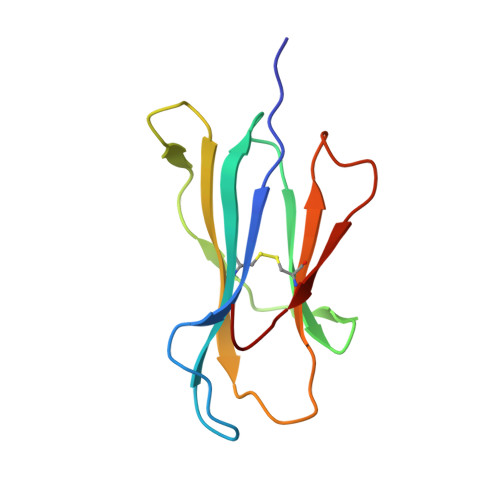
Beta-2-microglobulin
B, G, L, Q
100Homo sapiensMutation(s): 0 
Gene Names: B2MCDABP0092HDCMA22P
UniProt & NIH Common Fund Data Resources
Find proteins for P61769 (Homo sapiens)
Explore P61769 
Go to UniProtKB:  P61769
PHAROS:  P61769
GTEx:  ENSG00000166710 
Entity Groups  
Sequence Clusters30% Identity50% Identity70% Identity90% Identity95% Identity100% Identity
UniProt GroupP61769
Sequence Annotations
Expand
  • Reference Sequence

Find similar proteins by:  Sequence   |   3D Structure  

Entity ID: 3
MoleculeChains Sequence LengthOrganismDetailsImage
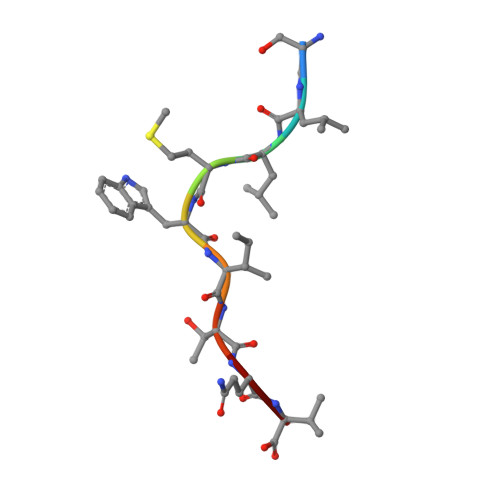
Heteroclitic NY-ESO-1 157-165 peptide
C, H, M, R
9Homo sapiensMutation(s): 0 
UniProt & NIH Common Fund Data Resources
Find proteins for P78358 (Homo sapiens)
Explore P78358 
Go to UniProtKB:  P78358
PHAROS:  P78358
Entity Groups  
UniProt GroupP78358
Sequence Annotations
Expand
  • Reference Sequence
Find similar proteins by:  (by identity cutoff)  |  3D Structure
Entity ID: 4
MoleculeChains Sequence LengthOrganismDetailsImage
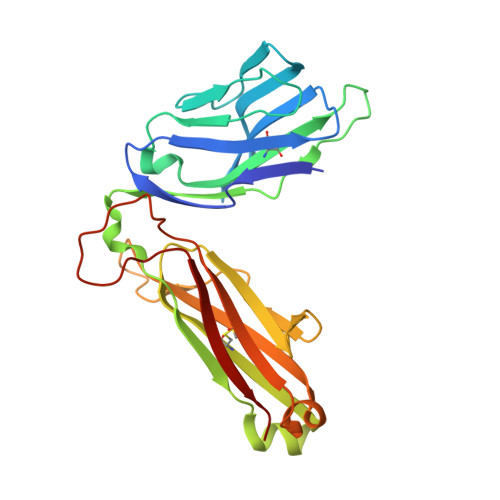
T-cell receptor alpha chain
D, I, N, S
206Homo sapiensMutation(s): 0 
Entity Groups  
Sequence Clusters30% Identity50% Identity70% Identity90% Identity95% Identity100% Identity
Sequence Annotations
Expand
  • Reference Sequence
Find similar proteins by:  (by identity cutoff)  |  3D Structure
Entity ID: 5
MoleculeChains Sequence LengthOrganismDetailsImage
T-cell receptor beta chain
E, J, O, T
244Homo sapiensMutation(s): 0 
Entity Groups  
Sequence Clusters30% Identity50% Identity70% Identity90% Identity95% Identity100% Identity
Sequence Annotations
Expand
  • Reference Sequence
Experimental Data & Validation

Experimental Data

  • Method: X-RAY DIFFRACTION
  • Resolution: 2.50 Å
  • R-Value Free: 0.273 
  • R-Value Work: 0.249 
  • R-Value Observed: 0.250 
  • Space Group: P 1
Unit Cell:
Length ( Å )Angle ( ˚ )
a = 75.342α = 93.02
b = 77.134β = 93.45
c = 184.632γ = 108.16
Software Package:
Software NamePurpose
REFMACrefinement
xia2data reduction
xia2data scaling
PHASERphasing

Structure Validation

View Full Validation Report


Entry History 

Revision History  (Full details and data files)

  • Version 1.0: 2020-01-15
    Type: Initial release
  • Version 1.1: 2020-03-11
    Changes: Database references
  • Version 1.2: 2020-04-08
    Changes: Database references
  • Version 1.3: 2024-01-24
    Changes: Data collection, Database references, Refinement description