6IQM

Crystal Structure of Cell Surface Glyceraldehyde-3-Phosphate Dehydrogenase Complexed with NAD+ from Lactobacillus plantarum


Experimental Data Snapshot

  • Method: X-RAY DIFFRACTION
  • Resolution: 1.85 Å
  • R-Value Free: 0.190 
  • R-Value Work: 0.159 
  • R-Value Observed: 0.160 

Starting Model: experimental
View more details

wwPDB Validation   3D Report Full Report


Ligand Structure Quality Assessment 


This is version 1.2 of the entry. See complete history


Literature

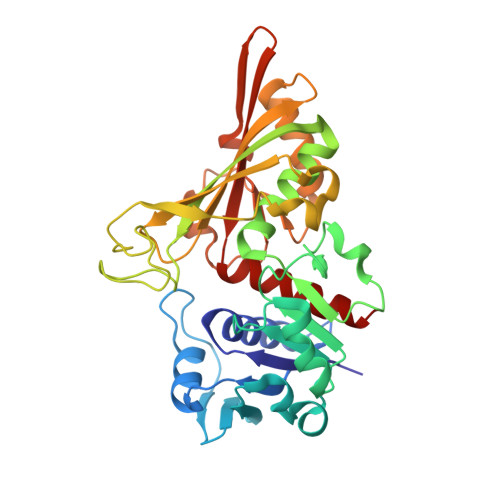
Crystal Structure of Cell Surface Glyceraldehyde-3-Phosphate Dehydrogenase from Lactobacillus plantarum: Insight into the Mercury Binding Mechanism

Yoneda, K.Ogata, M.Nishiyama, K.Fukuda, K.Yasuda, S.Igoshi, K.Kinoshita, H.

(2019) Milk Sci 68: 3-11


Macromolecules
Find similar proteins by:  (by identity cutoff)  |  3D Structure
Entity ID: 1
MoleculeChains Sequence LengthOrganismDetailsImage
Glyceraldehyde-3-phosphate dehydrogenase, type I
A, B, C, D
340Lactiplantibacillus plantarum subsp. plantarum ATCC 14917 = JCM 1149 = CGMCC 1.2437Mutation(s): 0 
Gene Names: gapHMPREF0531_11006
EC: 1.2.1.12
UniProt
Find proteins for D7VA33 (Lactiplantibacillus plantarum subsp. plantarum ATCC 14917 = JCM 1149 = CGMCC 1.2437)
Explore D7VA33 
Go to UniProtKB:  D7VA33
Entity Groups  
Sequence Clusters30% Identity50% Identity70% Identity90% Identity95% Identity100% Identity
UniProt GroupD7VA33
Sequence Annotations
Expand
  • Reference Sequence
Small Molecules
Ligands 3 Unique
IDChains Name / Formula / InChI Key2D Diagram3D Interactions
NAD
Query on NAD

Download Ideal Coordinates CCD File 
E [auth A],
I [auth B],
K [auth C],
M [auth D]
NICOTINAMIDE-ADENINE-DINUCLEOTIDE
C21 H27 N7 O14 P2
BAWFJGJZGIEFAR-NNYOXOHSSA-N
TRS
Query on TRS

Download Ideal Coordinates CCD File 
H [auth B]2-AMINO-2-HYDROXYMETHYL-PROPANE-1,3-DIOL
C4 H12 N O3
LENZDBCJOHFCAS-UHFFFAOYSA-O
EDO
Query on EDO

Download Ideal Coordinates CCD File 
F [auth A],
G [auth A],
J [auth B],
L [auth C],
N [auth D]
1,2-ETHANEDIOL
C2 H6 O2
LYCAIKOWRPUZTN-UHFFFAOYSA-N
Experimental Data & Validation

Experimental Data

  • Method: X-RAY DIFFRACTION
  • Resolution: 1.85 Å
  • R-Value Free: 0.190 
  • R-Value Work: 0.159 
  • R-Value Observed: 0.160 
  • Space Group: C 2 2 21
Unit Cell:
Length ( Å )Angle ( ˚ )
a = 126.207α = 90
b = 171.953β = 90
c = 149.752γ = 90
Software Package:
Software NamePurpose
REFMACrefinement
HKL-2000data reduction
HKL-2000data scaling
MOLREPphasing

Structure Validation

View Full Validation Report


Ligand Structure Quality Assessment 


Entry History 

Deposition Data

Revision History  (Full details and data files)

  • Version 1.0: 2018-11-21
    Type: Initial release
  • Version 1.1: 2019-05-15
    Changes: Data collection, Database references
  • Version 1.2: 2023-11-22
    Changes: Data collection, Database references, Refinement description