6ES3 | pdb_00006es3

Structure of CDX2-DNA(TCG)


Experimental Data Snapshot

  • Method: X-RAY DIFFRACTION
  • Resolution: 2.57 Å
  • R-Value Free: 
    0.278 (Depositor), 0.278 (DCC) 
  • R-Value Work: 
    0.216 (Depositor), 0.218 (DCC) 
  • R-Value Observed: 
    0.222 (Depositor) 

Starting Model: experimental
View more details

wwPDB Validation 3D Report Full Report

Validation slider image for 6ES3

This is version 1.3 of the entry. See complete history

Literature

Two distinct DNA sequences recognized by transcription factors represent enthalpy and entropy optima.

Morgunova, E.Yin, Y.Das, P.K.Jolma, A.Zhu, F.Popov, A.Xu, Y.Nilsson, L.Taipale, J.

(2018) Elife 7

  • DOI: https://doi.org/10.7554/eLife.32963
  • Primary Citation Related Structures: 
    5EDN, 5EEA, 6ES2, 6ES3

  • PubMed Abstract: 

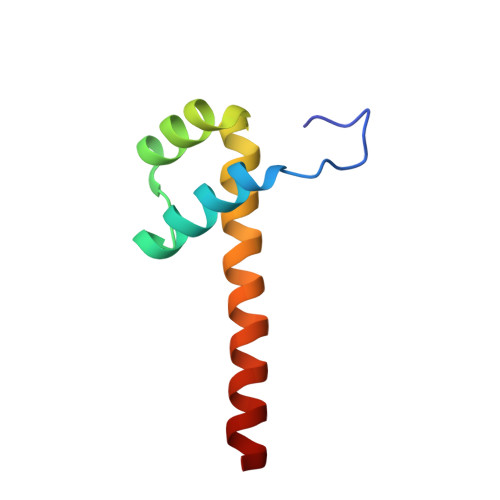
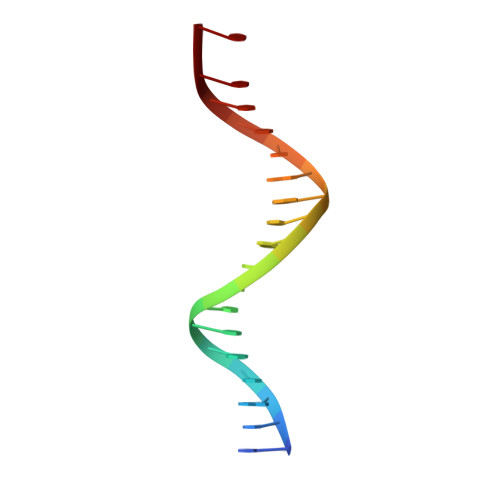
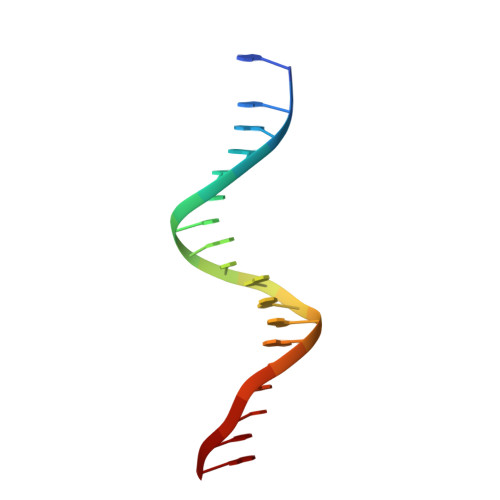
    Most transcription factors (TFs) can bind to a population of sequences closely related to a single optimal site. However, some TFs can bind to two distinct sequences that represent two local optima in the Gibbs free energy of binding (ΔG). To determine the molecular mechanism behind this effect, we solved the structures of human HOXB13 and CDX2 bound to their two optimal DNA sequences, CAATAAA and TCGTAAA. Thermodynamic analyses by isothermal titration calorimetry revealed that both sites were bound with similar ΔG. However, the interaction with the CAA sequence was driven by change in enthalpy (ΔH), whereas the TCG site was bound with similar affinity due to smaller loss of entropy (ΔS). This thermodynamic mechanism that leads to at least two local optima likely affects many macromolecular interactions, as ΔG depends on two partially independent variables ΔH and ΔS according to the central equation of thermodynamics, ΔG = ΔH - TΔS.


  • Organizational Affiliation
    • Department of Medical Biochemistry and Biophysics, Karolinska Institutet, Stockholm, Sweden.

Macromolecule Content 

  • Total Structure Weight: 40.12 kDa 
  • Atom Count: 2,841 
  • Modeled Residue Count: 216 
  • Deposited Residue Count: 216 
  • Unique protein chains: 1
  • Unique nucleic acid chains: 2

Macromolecules


Find similar proteins by:|  3D Structure
Entity ID: 2
MoleculeChains  Sequence LengthOrganismDetailsImage
Homeobox protein CDX-2C [auth K],
D [auth M]
72Homo sapiensMutation(s): 0 
Gene Names: CDX2CDX3
UniProt & NIH Common Fund Data Resources
Find proteins for Q99626 (Homo sapiens)
Explore Q99626 
Go to UniProtKB:  Q99626
PHAROS:  Q99626
GTEx:  ENSG00000165556 
Entity Groups
Sequence Clusters30% Identity50% Identity70% Identity90% Identity95% Identity100% Identity
UniProt GroupQ99626
Sequence Annotations
Expand
Reference Sequence
Find similar nucleic acids by:  Sequence
Entity ID: 1
MoleculeChains LengthOrganismImage
DNA (5'-D(P*TP*TP*GP*TP*GP*TP*TP*TP*TP*AP*CP*GP*AP*CP*CP*TP*CP*C)-3')
A, B
18Homo sapiens
Sequence Annotations
Expand
Reference Sequence
Find similar nucleic acids by:  Sequence
Entity ID: 3
MoleculeChains LengthOrganismImage
DNA (5'-D(P*GP*GP*AP*GP*GP*TP*CP*GP*TP*AP*AP*AP*AP*CP*AP*CP*AP*A)-3')E [auth F],
F [auth E]
18Homo sapiens
Sequence Annotations
Expand
Reference Sequence

Experimental Data & Validation

Experimental Data

  • Method: X-RAY DIFFRACTION
  • Resolution: 2.57 Å
  • R-Value Free:  0.278 (Depositor), 0.278 (DCC) 
  • R-Value Work:  0.216 (Depositor), 0.218 (DCC) 
  • R-Value Observed: 0.222 (Depositor) 
Space Group: C 1 2 1
Unit Cell:
Length ( Å )Angle ( ˚ )
a = 127.95α = 90
b = 46.49β = 113.27
c = 68.89γ = 90
Software Package:
Software NamePurpose
XSCALEdata scaling
REFMACrefinement
PDB_EXTRACTdata extraction
XDSdata reduction
PHASERphasing

Structure Validation

View Full Validation Report


Entry History 

Deposition Data

Revision History  (Full details and data files)

  • Version 1.0: 2018-03-21
    Type: Initial release
  • Version 1.1: 2018-05-16
    Changes: Data collection, Database references
  • Version 1.2: 2019-12-25
    Changes: Data collection
  • Version 1.3: 2024-01-17
    Changes: Data collection, Database references, Refinement description