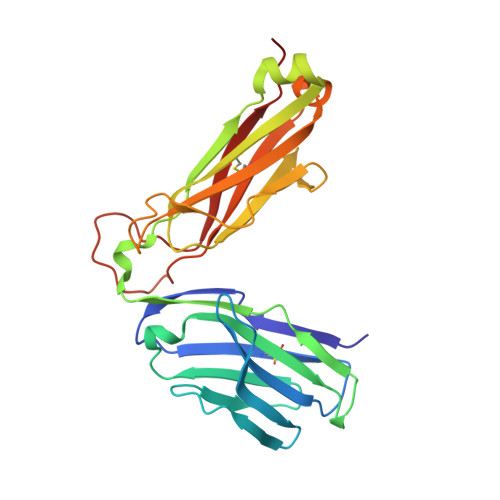
6EQB

HLA class I histocompatibility antigen


Experimental Data Snapshot

  • Method: X-RAY DIFFRACTION
  • Resolution: 2.81 Å
  • R-Value Free: 0.251 
  • R-Value Work: 0.183 
  • R-Value Observed: 0.186 

Starting Model: experimental
View more details

wwPDB Validation   3D Report Full Report


This is version 1.3 of the entry. See complete history


Literature

TCR-induced alteration of primary MHC peptide anchor residue.

Madura, F.Rizkallah, P.J.Legut, M.Holland, C.J.Fuller, A.Bulek, A.Schauenburg, A.J.Trimby, A.Hopkins, J.R.Wells, S.A.Godkin, A.Miles, J.J.Sami, M.Li, Y.Liddy, N.Jakobsen, B.K.Loveridge, E.J.Cole, D.K.Sewell, A.K.

(2019) Eur J Immunol 49: 1052-1066

  • DOI: https://doi.org/10.1002/eji.201948085
  • Primary Citation of Related Structures:  
    6EQA, 6EQB

  • PubMed Abstract: 

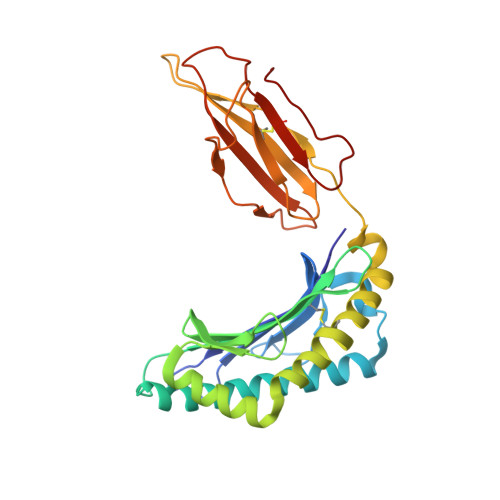
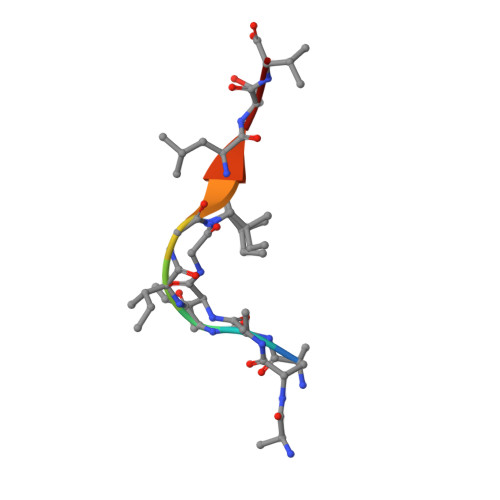
    The HLA-A*02:01-restricted decapeptide EAAGIGILTV, derived from melanoma antigen recognized by T-cells-1 (MART-1) protein, represents one of the best-studied tumor associated T-cell epitopes, but clinical results targeting this peptide have been disappointing. This limitation may reflect the dominance of the nonapeptide, AAGIGILTV, at the melanoma cell surface. The decapeptide and nonapeptide are presented in distinct conformations by HLA-A*02:01 and TCRs from clinically relevant T-cell clones recognize the nonapeptide poorly. Here, we studied the MEL5 TCR that potently recognizes the nonapeptide. The structure of the MEL5-HLA-A*02:01-AAGIGILTV complex revealed an induced fit mechanism of antigen recognition involving altered peptide-MHC anchoring. This "flexing" at the TCR-peptide-MHC interface to accommodate the peptide antigen explains previously observed incongruences in this well-studied system and has important implications for future therapeutic approaches. Finally, this study expands upon the mechanisms by which molecular plasticity can influence antigen recognition by T cells.


  • Organizational Affiliation

    School of Medicine, Cardiff University, Cardiff, UK.


Macromolecules
Find similar proteins by:  (by identity cutoff)  |  3D Structure
Entity ID: 1
MoleculeChains Sequence LengthOrganismDetailsImage
HLA class I histocompatibility antigen, A-2 alpha chain276Homo sapiensMutation(s): 0 
Gene Names: HLA-AHLAA
UniProt & NIH Common Fund Data Resources
Find proteins for P04439 (Homo sapiens)
Explore P04439 
Go to UniProtKB:  P04439
PHAROS:  P04439
GTEx:  ENSG00000206503 
Entity Groups  
Sequence Clusters30% Identity50% Identity70% Identity90% Identity95% Identity100% Identity
UniProt GroupP04439
Sequence Annotations
Expand
  • Reference Sequence
Find similar proteins by:  (by identity cutoff)  |  3D Structure
Entity ID: 2
MoleculeChains Sequence LengthOrganismDetailsImage
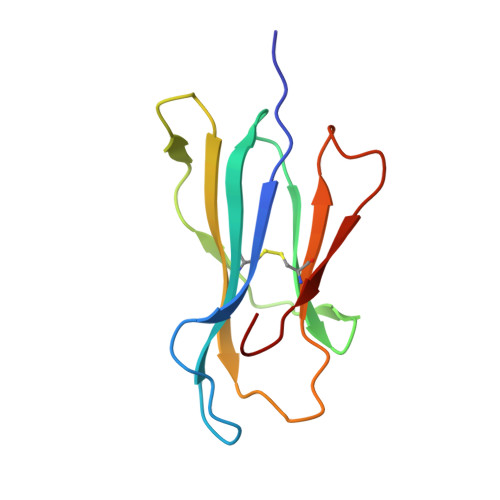
Beta-2-microglobulin100Homo sapiensMutation(s): 0 
Gene Names: B2MCDABP0092HDCMA22P
UniProt & NIH Common Fund Data Resources
Find proteins for P61769 (Homo sapiens)
Explore P61769 
Go to UniProtKB:  P61769
PHAROS:  P61769
GTEx:  ENSG00000166710 
Entity Groups  
Sequence Clusters30% Identity50% Identity70% Identity90% Identity95% Identity100% Identity
UniProt GroupP61769
Sequence Annotations
Expand
  • Reference Sequence

Find similar proteins by:  Sequence   |   3D Structure  

Entity ID: 3
MoleculeChains Sequence LengthOrganismDetailsImage
ALA-ALA-GLY-ILE-GLY-ILE-LEU-THR-VAL9Homo sapiensMutation(s): 0 
Sequence Annotations
Expand
  • Reference Sequence
Find similar proteins by:  (by identity cutoff)  |  3D Structure
Entity ID: 4
MoleculeChains Sequence LengthOrganismDetailsImage
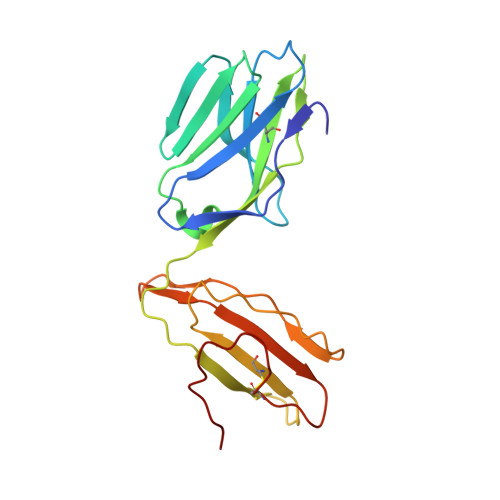
High Affinity Mel5 TCR, alpha chain196Homo sapiensMutation(s): 0 
Entity Groups  
Sequence Clusters30% Identity50% Identity70% Identity90% Identity95% Identity100% Identity
Sequence Annotations
Expand
  • Reference Sequence
Find similar proteins by:  (by identity cutoff)  |  3D Structure
Entity ID: 5
MoleculeChains Sequence LengthOrganismDetailsImage
High Affinity Mel5 TCR, beta chain244Homo sapiensMutation(s): 0 
Entity Groups  
Sequence Clusters30% Identity50% Identity70% Identity90% Identity95% Identity100% Identity
Sequence Annotations
Expand
  • Reference Sequence
Small Molecules
Ligands 3 Unique
IDChains Name / Formula / InChI Key2D Diagram3D Interactions
EPE
Query on EPE

Download Ideal Coordinates CCD File 
F [auth A],
G [auth A]
4-(2-HYDROXYETHYL)-1-PIPERAZINE ETHANESULFONIC ACID
C8 H18 N2 O4 S
JKMHFZQWWAIEOD-UHFFFAOYSA-N
SO4
Query on SO4

Download Ideal Coordinates CCD File 
H [auth A],
I [auth A],
J [auth B],
M [auth D]
SULFATE ION
O4 S
QAOWNCQODCNURD-UHFFFAOYSA-L
EDO
Query on EDO

Download Ideal Coordinates CCD File 
K [auth D],
L [auth D]
1,2-ETHANEDIOL
C2 H6 O2
LYCAIKOWRPUZTN-UHFFFAOYSA-N
Experimental Data & Validation

Experimental Data

  • Method: X-RAY DIFFRACTION
  • Resolution: 2.81 Å
  • R-Value Free: 0.251 
  • R-Value Work: 0.183 
  • R-Value Observed: 0.186 
  • Space Group: P 43
Unit Cell:
Length ( Å )Angle ( ˚ )
a = 120.771α = 90
b = 120.771β = 90
c = 82.247γ = 90
Software Package:
Software NamePurpose
SCALAdata scaling
PHASERphasing
REFMACrefinement
PDB_EXTRACTdata extraction
xia2data reduction
XDSdata reduction

Structure Validation

View Full Validation Report


Entry History 

Deposition Data

Revision History  (Full details and data files)

  • Version 1.0: 2018-10-10
    Type: Initial release
  • Version 1.1: 2020-04-22
    Changes: Database references, Structure summary
  • Version 1.2: 2024-01-17
    Changes: Data collection, Database references, Refinement description
  • Version 1.3: 2024-11-20
    Changes: Structure summary