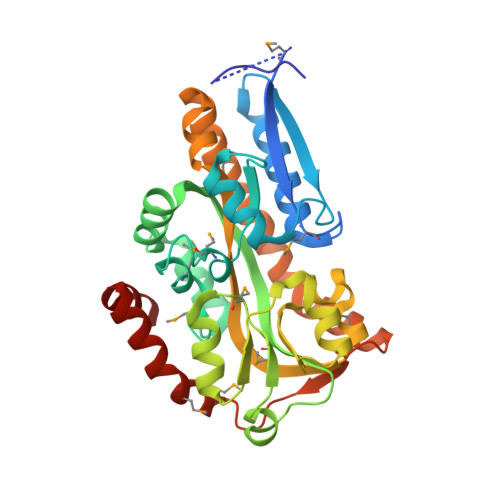
4OVP

CRYSTAL STRUCTURE OF A TRAP PERIPLASMIC SOLUTE BINDING PROTEIN FROM SULFITOBACTER sp. NAS-14.1, TARGET EFI-510292, WITH BOUND ALPHA-D-MANURONATE


Experimental Data Snapshot

  • Method: X-RAY DIFFRACTION
  • Resolution: 1.70 Å
  • R-Value Free: 0.180 
  • R-Value Work: 0.149 
  • R-Value Observed: 0.151 

wwPDB Validation   3D Report Full Report


Ligand Structure Quality Assessment 


This is version 1.7 of the entry. See complete history


Literature

Experimental strategies for functional annotation and metabolism discovery: targeted screening of solute binding proteins and unbiased panning of metabolomes.

Vetting, M.W.Al-Obaidi, N.Zhao, S.San Francisco, B.Kim, J.Wichelecki, D.J.Bouvier, J.T.Solbiati, J.O.Vu, H.Zhang, X.Rodionov, D.A.Love, J.D.Hillerich, B.S.Seidel, R.D.Quinn, R.J.Osterman, A.L.Cronan, J.E.Jacobson, M.P.Gerlt, J.A.Almo, S.C.

(2015) Biochemistry 54: 909-931

  • DOI: https://doi.org/10.1021/bi501388y
  • Primary Citation of Related Structures:  
    4LN5, 4MCO, 4MEV, 4MHF, 4MIJ, 4MNC, 4MNI, 4MX6, 4N15, 4N17, 4N4U, 4N6D, 4N6K, 4N8G, 4N8Y, 4N91, 4NAP, 4NF0, 4NG7, 4NGU, 4NHB, 4NN3, 4NQ8, 4NX1, 4O7M, 4O8M, 4O94, 4OA4, 4OAN, 4OVP, 4OVQ, 4OVR, 4OVS, 4OVT, 4P1E, 4P1L, 4P3L, 4P47, 4P56, 4P8B, 4P9K, 4PAF, 4PAI, 4PAK, 4PBH, 4PBQ, 4PC9, 4PCD, 4PDD, 4PDH

  • PubMed Abstract: 

    The rate at which genome sequencing data is accruing demands enhanced methods for functional annotation and metabolism discovery. Solute binding proteins (SBPs) facilitate the transport of the first reactant in a metabolic pathway, thereby constraining the regions of chemical space and the chemistries that must be considered for pathway reconstruction. We describe high-throughput protein production and differential scanning fluorimetry platforms, which enabled the screening of 158 SBPs against a 189 component library specifically tailored for this class of proteins. Like all screening efforts, this approach is limited by the practical constraints imposed by construction of the library, i.e., we can study only those metabolites that are known to exist and which can be made in sufficient quantities for experimentation. To move beyond these inherent limitations, we illustrate the promise of crystallographic- and mass spectrometric-based approaches for the unbiased use of entire metabolomes as screening libraries. Together, our approaches identified 40 new SBP ligands, generated experiment-based annotations for 2084 SBPs in 71 isofunctional clusters, and defined numerous metabolic pathways, including novel catabolic pathways for the utilization of ethanolamine as sole nitrogen source and the use of d-Ala-d-Ala as sole carbon source. These efforts begin to define an integrated strategy for realizing the full value of amassing genome sequence data.


  • Organizational Affiliation

    Department of Biochemistry, Albert Einstein College of Medicine , Bronx, New York 10461, United States.


Macromolecules
Find similar proteins by:  (by identity cutoff)  |  3D Structure
Entity ID: 1
MoleculeChains Sequence LengthOrganismDetailsImage
C4-dicarboxylate transport system substrate-binding protein
A, B
326Sulfitobacter sp. NAS-14.1Mutation(s): 0 
Gene Names: NAS141_03721
UniProt
Find proteins for A3T0D1 (Sulfitobacter sp. (strain NAS-14.1))
Explore A3T0D1 
Go to UniProtKB:  A3T0D1
Entity Groups  
Sequence Clusters30% Identity50% Identity70% Identity90% Identity95% Identity100% Identity
UniProt GroupA3T0D1
Sequence Annotations
Expand
  • Reference Sequence
Small Molecules
Ligands 1 Unique
IDChains Name / Formula / InChI Key2D Diagram3D Interactions
MAV
Query on MAV

Download Ideal Coordinates CCD File 
C [auth A],
D [auth B]
alpha-D-mannopyranuronic acid
C6 H10 O7
AEMOLEFTQBMNLQ-BYHBOUFCSA-N
Modified Residues  1 Unique
IDChains TypeFormula2D DiagramParent
MSE
Query on MSE
A, B
L-PEPTIDE LINKINGC5 H11 N O2 SeMET
Experimental Data & Validation

Experimental Data

  • Method: X-RAY DIFFRACTION
  • Resolution: 1.70 Å
  • R-Value Free: 0.180 
  • R-Value Work: 0.149 
  • R-Value Observed: 0.151 
  • Space Group: C 1 2 1
Unit Cell:
Length ( Å )Angle ( ˚ )
a = 127.481α = 90
b = 82.345β = 140.07
c = 106.829γ = 90
Software Package:
Software NamePurpose
SCALAdata scaling
PHENIXrefinement

Structure Validation

View Full Validation Report


Ligand Structure Quality Assessment 


Entry History & Funding Information

Deposition Data


Funding OrganizationLocationGrant Number
National Institutes of Health/National Institute of General Medical Sciences (NIH/NIGMS)United StatesGM093342

Revision History  (Full details and data files)

  • Version 1.0: 2014-01-08
    Type: Initial release
  • Version 1.1: 2014-01-22
    Changes: Structure summary
  • Version 1.2: 2015-02-04
    Changes: Derived calculations
  • Version 1.3: 2015-02-25
    Changes: Database references
  • Version 1.4: 2017-09-27
    Changes: Author supporting evidence, Database references, Derived calculations, Other, Refinement description, Source and taxonomy, Structure summary
  • Version 1.5: 2019-12-25
    Changes: Author supporting evidence, Data collection
  • Version 1.6: 2020-07-29
    Type: Remediation
    Reason: Carbohydrate remediation
    Changes: Data collection, Derived calculations, Refinement description
  • Version 1.7: 2023-12-27
    Changes: Data collection, Database references, Structure summary