3ZTX | pdb_00003ztx

Aurora kinase selective inhibitors identified using a Taxol-induced checkpoint sensitivity screen.


Experimental Data Snapshot

  • Method: X-RAY DIFFRACTION
  • Resolution: 1.95 Å
  • R-Value Free: 
    0.226 (Depositor), 0.226 (DCC) 
  • R-Value Work: 
    0.186 (Depositor), 0.185 (DCC) 
  • R-Value Observed: 
    0.188 (Depositor) 

wwPDB Validation 3D Report Full Report

Validation slider image for 3ZTX

Ligand Structure Quality Assessment 


This is version 1.1 of the entry. See complete history

Literature

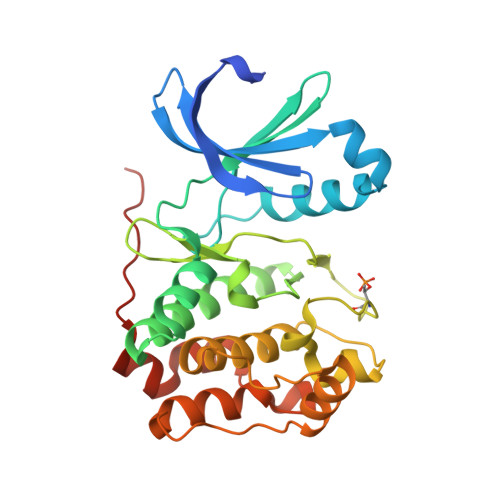
Selective Aurora Kinase Inhibitors Identified Using a Taxol- Induced Checkpoint Sensitivity Screen.

Kwiatkowski, N.Deng, X.Wang, J.Tan, L.Villa, F.Santaguida, S.Huang, H.C.Mitchison, T.Musacchio, A.Gray, N.

(2012) ACS Chem Biol 7: 185

  • DOI: https://doi.org/10.1021/cb200305u
  • Primary Citation Related Structures: 
    3ZTX

  • PubMed Abstract: 

    The members of the Aurora kinase family play critical roles in the regulation of the cell cycle and mitotic spindle assembly and have been intensively investigated as potential targets for a new class of anticancer drugs. We describe a new highly potent and selective class of Aurora kinase inhibitors discovered using a phenotypic cellular screen. Optimized inhibitors display many of the hallmarks of Aurora inhibition including endoreduplication, polyploidy, and loss of cell viability in cancer cells. Structure-activity relationships with respect to kinome-wide selectivity and guided by an Aurora B co-crystal structure resulted in the identification of key selectivity determinants and discovery of a subseries with selectivity toward Aurora A. A direct comparison of biochemical and cellular profiles with respect to published Aurora inhibitors including VX-680, AZD1152, MLN8054, and a pyrimidine-based compound from Genentech demonstrates that compounds 1 and 3 will become valuable additional pharmacological probes of Aurora-dependent functions.


  • Organizational Affiliation
    • Department of Cancer Biology, Dana Farber Cancer Institute, Harvard Medical School, Boston, Massachusetts 02115, United States.

Macromolecule Content 

  • Total Structure Weight: 78.08 kDa 
  • Atom Count: 5,567 
  • Modeled Residue Count: 626 
  • Deposited Residue Count: 656 
  • Unique protein chains: 2

Macromolecules

Find similar proteins by:|  3D Structure
Entity ID: 1
MoleculeChains  Sequence LengthOrganismDetailsImage
SERINE/THREONINE-PROTEIN KINASE 12-A
A, B
284Xenopus laevisMutation(s): 0 
EC: 2.7.11.1
UniProt
Find proteins for Q6DE08 (Xenopus laevis)
Explore Q6DE08 
Go to UniProtKB:  Q6DE08
Entity Groups
Sequence Clusters30% Identity50% Identity70% Identity90% Identity95% Identity100% Identity
UniProt GroupQ6DE08
Sequence Annotations
Expand
Reference Sequence
Find similar proteins by:|  3D Structure
Entity ID: 2
MoleculeChains  Sequence LengthOrganismDetailsImage
INNER CENTROMERE PROTEIN A
C, D
44Xenopus laevisMutation(s): 0 
UniProt
Find proteins for O13024 (Xenopus laevis)
Explore O13024 
Go to UniProtKB:  O13024
Entity Groups
Sequence Clusters30% Identity50% Identity70% Identity90% Identity95% Identity100% Identity
UniProt GroupO13024
Sequence Annotations
Expand
Reference Sequence

Small Molecules

Ligands 1 Unique
IDChains Name / Formula / InChI Key2D Diagram3D Interactions
ZTX

Query on ZTX


Download:Ideal Coordinates CCD File
E [auth A],
F [auth B]
2-((4-(4-HYDROXYPIPERIDIN-1-YL)PHENYL)AMINO)-5,11-DIMETHYL-5H-BENZO[E]PYRIMIDO [5,4-B][1,4]DIAZEPIN-6(11H)-ONE
C24 H26 N6 O2
DFQAJLQXPSPNJE-UHFFFAOYSA-N
Modified Residues  1 Unique
IDChains TypeFormula2D DiagramParent
TPO
Query on TPO
A, B
L-PEPTIDE LINKINGC4 H10 N O6 PTHR

Experimental Data & Validation

Experimental Data

  • Method: X-RAY DIFFRACTION
  • Resolution: 1.95 Å
  • R-Value Free:  0.226 (Depositor), 0.226 (DCC) 
  • R-Value Work:  0.186 (Depositor), 0.185 (DCC) 
  • R-Value Observed: 0.188 (Depositor) 
Space Group: P 1 21 1
Unit Cell:
Length ( Å )Angle ( ˚ )
a = 45.634α = 90
b = 66.364β = 96.56
c = 116.679γ = 90
Software Package:
Software NamePurpose
REFMACrefinement
DENZOdata reduction
SCALEPACKdata scaling
MOLREPphasing

Structure Validation

View Full Validation Report


Ligand Structure Quality Assessment 


Entry History 

Deposition Data

Revision History  (Full details and data files)

  • Version 1.0: 2012-02-01
    Type: Initial release
  • Version 1.1: 2024-11-13
    Changes: Data collection, Database references, Derived calculations, Other, Structure summary