3LB8

Crystal structure of the covalent putidaredoxin reductase-putidaredoxin complex


Experimental Data Snapshot

  • Method: X-RAY DIFFRACTION
  • Resolution: 2.60 Å
  • R-Value Free: 0.272 
  • R-Value Work: 0.244 
  • R-Value Observed: 0.244 

Starting Model: experimental
View more details

wwPDB Validation   3D Report Full Report


Ligand Structure Quality Assessment 


This is version 1.3 of the entry. See complete history


Literature

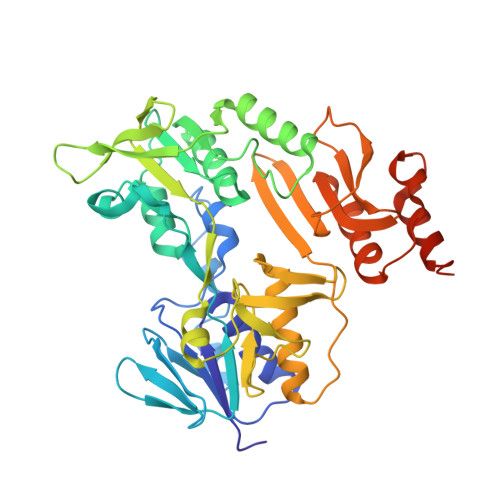
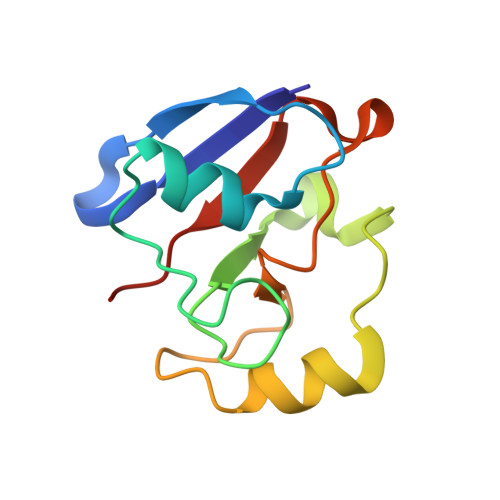
Crystal structure of the putidaredoxin reductase x putidaredoxin electron transfer complex.

Sevrioukova, I.F.Poulos, T.L.Churbanova, I.Y.

(2010) J Biol Chem 285: 13616-13620

  • DOI: https://doi.org/10.1074/jbc.M110.104968
  • Primary Citation of Related Structures:  
    3LB8

  • PubMed Abstract: 

    In the camphor monooxygenase system from Pseudomonas putida, the [2Fe-2S]-containing putidaredoxin (Pdx) shuttles electrons between the NADH-dependent putidaredoxin reductase (Pdr) and cytochrome P450(cam). The mechanism of the Pdr.Pdx redox couple has been investigated by a variety of techniques. One of the exceptions is x-ray crystallography as the native partners associate weakly and resist co-crystallization. Here, we present the 2.6-A x-ray structure of a catalytically active complex between Pdr and Pdx C73S/C85S chemically cross-linked via the Lys(409Pdr)-Glu(72Pdx) pair. The 365 A(2) Pdr-Pdx interface is predominantly hydrophobic with one central Arg(310Pdr)-Asp(38Pdx) salt bridge, likely assisting docking and orienting the partners optimally for electron transfer, and a few peripheral hydrogen bonds. A predicted 12-A-long electron transfer route between FAD and [2Fe-2S] includes flavin flanking Trp(330Pdr) and the iron ligand Cys(39Pdx). The x-ray model agrees well with the experimental and theoretical results and suggests that the linked Pdx must undergo complex movements during turnover to accommodate P450(cam), which could limit the Pdx-to-P450(cam) electron transfer reaction.


  • Organizational Affiliation

    Department of Molecular Biology and Biochemistry, University of California, Irvine, California 92697-3900, USA. sevrioui@uci.edu


Macromolecules
Find similar proteins by:  (by identity cutoff)  |  3D Structure
Entity ID: 1
MoleculeChains Sequence LengthOrganismDetailsImage
Putidaredoxin reductase
A, B
436Pseudomonas putidaMutation(s): 0 
Gene Names: camA
EC: 1.18.1
UniProt
Find proteins for P16640 (Pseudomonas putida)
Explore P16640 
Go to UniProtKB:  P16640
Entity Groups  
Sequence Clusters30% Identity50% Identity70% Identity90% Identity95% Identity100% Identity
UniProt GroupP16640
Sequence Annotations
Expand
  • Reference Sequence
Find similar proteins by:  (by identity cutoff)  |  3D Structure
Entity ID: 2
MoleculeChains Sequence LengthOrganismDetailsImage
Putidaredoxin
C, D
106Pseudomonas putidaMutation(s): 2 
Gene Names: camAcamB
UniProt
Find proteins for P00259 (Pseudomonas putida)
Explore P00259 
Go to UniProtKB:  P00259
Entity Groups  
Sequence Clusters30% Identity50% Identity70% Identity90% Identity95% Identity100% Identity
UniProt GroupP00259
Sequence Annotations
Expand
  • Reference Sequence
Experimental Data & Validation

Experimental Data

  • Method: X-RAY DIFFRACTION
  • Resolution: 2.60 Å
  • R-Value Free: 0.272 
  • R-Value Work: 0.244 
  • R-Value Observed: 0.244 
  • Space Group: P 21 21 21
Unit Cell:
Length ( Å )Angle ( ˚ )
a = 67.6α = 90
b = 103.4β = 90
c = 167.7γ = 90
Software Package:
Software NamePurpose
PHASERphasing
CNSrefinement
HKL-2000data reduction
SCALEPACKdata scaling

Structure Validation

View Full Validation Report


Ligand Structure Quality Assessment 


Entry History 

Deposition Data

Revision History  (Full details and data files)

  • Version 1.0: 2010-02-23
    Type: Initial release
  • Version 1.1: 2011-07-13
    Changes: Version format compliance
  • Version 1.2: 2021-10-13
    Changes: Database references, Derived calculations
  • Version 1.3: 2023-09-06
    Changes: Data collection, Refinement description