


Structure of macrophage migration inhibitory factor (MIF) with caffeic acid at 1.9A resolution
Crawley, L., Barker, J., Cheng, R.K.Y., Wood, M., Felicetti, B.To be published.
Experimental Data Snapshot
Starting Model: experimental
View more details
Entity ID: 1 | |||||
|---|---|---|---|---|---|
| Molecule | Chains | Sequence Length | Organism | Details | Image |
| Macrophage migration inhibitory factor | 123 | Homo sapiens | Mutation(s): 0 Gene Names: MIF EC: 5.3.2.1 (PDB Primary Data), 5.3.3.12 (UniProt) | 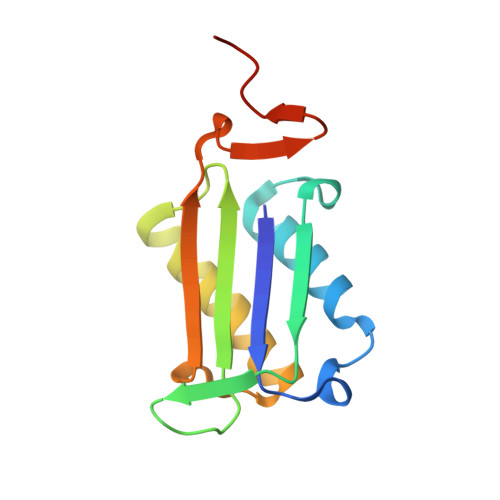 | |
UniProt & NIH Common Fund Data Resources | |||||
PHAROS: P14174 GTEx: ENSG00000240972 | |||||
Entity Groups | |||||
| Sequence Clusters | 30% Identity50% Identity70% Identity90% Identity95% Identity100% Identity | ||||
| UniProt Group | P14174 | ||||
Sequence AnnotationsExpand | |||||
Reference Sequence | |||||
| Ligands 1 Unique | |||||
|---|---|---|---|---|---|
| ID | Chains | Name / Formula / InChI Key | 2D Diagram | 3D Interactions | |
| DHC Download:Ideal Coordinates CCD File | D [auth C] | CAFFEIC ACID C9 H8 O4 QAIPRVGONGVQAS-DUXPYHPUSA-N |  | ||
| Length ( Å ) | Angle ( ˚ ) |
|---|---|
| a = 67.669 | α = 90 |
| b = 67.988 | β = 90 |
| c = 89.135 | γ = 90 |
| Software Name | Purpose |
|---|---|
| DNA | data collection |
| PHASER | phasing |
| REFMAC | refinement |
| CrystalClear | data reduction |
| CrystalClear | data scaling |


