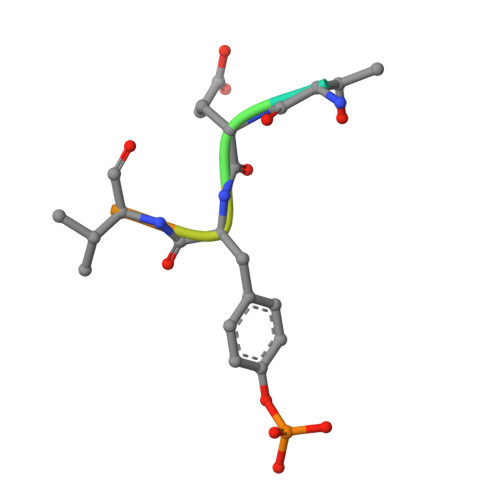
3D42

Crystal structure of HePTP in complex with a monophosphorylated Erk2 peptide


Experimental Data Snapshot

  • Method: X-RAY DIFFRACTION
  • Resolution: 2.46 Å
  • R-Value Free: 0.241 
  • R-Value Work: 0.181 
  • R-Value Observed: 0.184 

Starting Model: experimental
View more details

wwPDB Validation   3D Report Full Report


This is version 1.5 of the entry. See complete history


Literature

Structural basis of substrate recognition by hematopoietic tyrosine phosphatase.

Critton, D.A.Tortajada, A.Stetson, G.Peti, W.Page, R.

(2008) Biochemistry 47: 13336-13345

  • DOI: https://doi.org/10.1021/bi801724n
  • Primary Citation of Related Structures:  
    2HVL, 2QDC, 3D42, 3D44

  • PubMed Abstract: 

    Hematopoietic tyrosine phosphatase (HePTP) is one of three members of the kinase interaction motif (KIM) phosphatase family which also includes STEP and PCPTP1. The KIM-PTPs are characterized by a 15 residue sequence, the KIM, which confers specific high-affinity binding to their only known substrates, the MAP kinases Erk and p38, an interaction which is critical for their ability to regulate processes such as T cell differentiation (HePTP) and neuronal signaling (STEP). The KIM-PTPs are also characterized by a unique set of residues in their PTP substrate binding loops, where 4 of the 13 residues are differentially conserved among the KIM-PTPs as compared to more than 30 other class I PTPs. One of these residues, T106 in HePTP, is either an aspartate or asparagine in nearly every other PTP. Using multiple techniques, we investigate the role of these KIM-PTP specific residues in order to elucidate the molecular basis of substrate recognition by HePTP. First, we used NMR spectroscopy to show that Erk2-derived peptides interact specifically with HePTP at the active site. Next, to reveal the molecular details of this interaction, we solved the high-resolution three-dimensional structures of two distinct HePTP-Erk2 peptide complexes. Strikingly, we were only able to obtain crystals of these transient complexes using a KIM-PTP specific substrate-trapping mutant, in which the KIM-PTP specific residue T106 was mutated to an aspartic acid (T106D). The introduced aspartate side chain facilitates the coordination of the bound peptides, thereby stabilizing the active dephosphorylation complex. These structures establish the essential role of HePTP T106 in restricting HePTP specificity to only those substrates which are able to interact with KIM-PTPs via the KIM (e.g., Erk2, p38). Finally, we describe how this interaction of the KIM is sufficient for overcoming the otherwise weak interaction at the active site of KIM-PTPs.


  • Organizational Affiliation

    Department of Molecular Biology, Brown University, Providence, Rhode Island 02912, USA.


Macromolecules
Find similar proteins by:  (by identity cutoff)  |  3D Structure
Entity ID: 1
MoleculeChains Sequence LengthOrganismDetailsImage
Tyrosine-protein phosphatase non-receptor type 7308Homo sapiensMutation(s): 2 
Gene Names: PTPN7
EC: 3.1.3.48
UniProt & NIH Common Fund Data Resources
Find proteins for P35236 (Homo sapiens)
Explore P35236 
Go to UniProtKB:  P35236
PHAROS:  P35236
GTEx:  ENSG00000143851 
Entity Groups  
Sequence Clusters30% Identity50% Identity70% Identity90% Identity95% Identity100% Identity
UniProt GroupP35236
Sequence Annotations
Expand
  • Reference Sequence

Find similar proteins by:  Sequence   |   3D Structure  

Entity ID: 2
MoleculeChains Sequence LengthOrganismDetailsImage
Mitogen-activated protein kinase 1 peptide8N/AMutation(s): 0 
EC: 2.7.11.24
UniProt & NIH Common Fund Data Resources
Find proteins for P28482 (Homo sapiens)
Explore P28482 
Go to UniProtKB:  P28482
PHAROS:  P28482
GTEx:  ENSG00000100030 
Entity Groups  
UniProt GroupP28482
Sequence Annotations
Expand
  • Reference Sequence
Small Molecules
Modified Residues  1 Unique
IDChains TypeFormula2D DiagramParent
PTR
Query on PTR
B
L-PEPTIDE LINKINGC9 H12 N O6 PTYR
Experimental Data & Validation

Experimental Data

  • Method: X-RAY DIFFRACTION
  • Resolution: 2.46 Å
  • R-Value Free: 0.241 
  • R-Value Work: 0.181 
  • R-Value Observed: 0.184 
  • Space Group: C 1 2 1
Unit Cell:
Length ( Å )Angle ( ˚ )
a = 118.46α = 90
b = 39.035β = 124.59
c = 83.65γ = 90
Software Package:
Software NamePurpose
REFMACrefinement
HKL-2000data collection
HKL-2000data reduction
HKL-2000data scaling
PHASERphasing

Structure Validation

View Full Validation Report


Entry History 

Deposition Data

Revision History  (Full details and data files)

  • Version 1.0: 2009-03-17
    Type: Initial release
  • Version 1.1: 2011-07-13
    Changes: Non-polymer description, Version format compliance
  • Version 1.2: 2021-10-20
    Changes: Database references, Derived calculations
  • Version 1.3: 2023-08-30
    Changes: Data collection, Refinement description
  • Version 1.4: 2023-11-15
    Changes: Data collection
  • Version 1.5: 2024-10-16
    Changes: Structure summary