2IZV

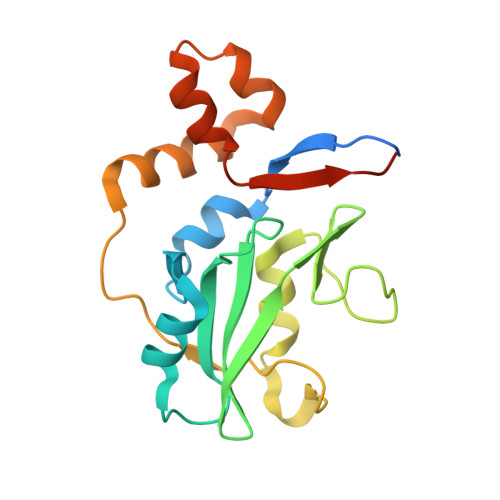
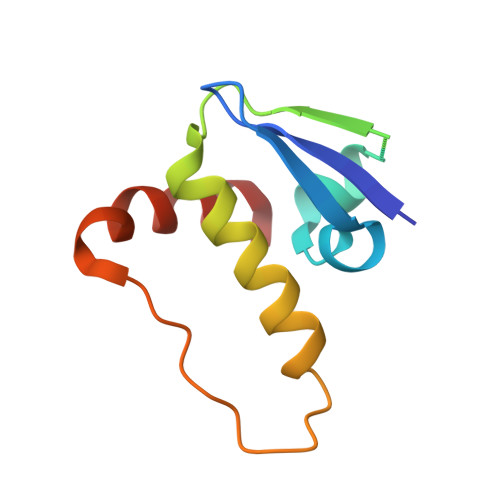
CRYSTAL STRUCTURE OF SOCS-4 IN COMPLEX WITH ELONGIN-B AND ELONGIN-C AT 2.55A RESOLUTION


Experimental Data Snapshot

  • Method: X-RAY DIFFRACTION
  • Resolution: 2.55 Å
  • R-Value Free: 0.223 
  • R-Value Work: 0.172 
  • R-Value Observed: 0.175 

Starting Model: experimental
View more details

wwPDB Validation   3D Report Full Report


This is version 1.5 of the entry. See complete history


Literature

Structure of the SOCS4-ElonginB/C complex reveals a distinct SOCS box interface and the molecular basis for SOCS-dependent EGFR degradation.

Bullock, A.N.Rodriguez, M.C.Debreczeni, J.E.Songyang, Z.Knapp, S.

(2007) Structure 15: 1493-1504

  • DOI: https://doi.org/10.1016/j.str.2007.09.016
  • Primary Citation of Related Structures:  
    2IZV

  • PubMed Abstract: 

    Tyrosine kinase signaling is tightly controlled by negative feedback inhibitors including suppressors of cytokine signaling (SOCS). SOCS assemble as SH2 domain substrate recognition modules in ElonginB/C-cullin ubiquitin ligases. In accordance, SOCS4 reduces STAT3 signaling from EGFR through increased receptor degradation. Variable C-termini in SOCS4-SOCS7 exclude these family members from a SOCS2-type domain arrangement in which a strictly conserved C terminus determines domain packing. The structure of the SOCS4-ElonginC-ElonginB complex reveals a distinct SOCS structural class. The N-terminal ESS helix functionally replaces the CIS/SOCS1-SOCS3 family C terminus in a distinct SH2-SOCS box interface that facilitates further interdomain packing between the extended N- and C-terminal regions characteristic for this subfamily. Using peptide arrays and calorimetry the STAT3 site in EGFR (pY(1092)) was identified as a high affinity SOCS4 substrate (K(D) = 0.5 microM) revealing a mechanism for EGFR degradation. SOCS4 also bound JAK2 and KIT with low micromolar affinity, whereas SOCS2 was specific for GH-receptor.


  • Organizational Affiliation

    University of Oxford, Structural Genomics Consortium, Botnar Research Centre, Oxford OX3 7LD, United Kingdom. alex.bullock@sgc.ox.ac.uk


Macromolecules
Find similar proteins by:  (by identity cutoff)  |  3D Structure
Entity ID: 1
MoleculeChains Sequence LengthOrganismDetailsImage
SUPPRESSOR OF CYTOKINE SIGNALING 4187Homo sapiensMutation(s): 0 
UniProt & NIH Common Fund Data Resources
Find proteins for Q8WXH5 (Homo sapiens)
Explore Q8WXH5 
Go to UniProtKB:  Q8WXH5
PHAROS:  Q8WXH5
GTEx:  ENSG00000180008 
Entity Groups  
Sequence Clusters30% Identity50% Identity70% Identity90% Identity95% Identity100% Identity
UniProt GroupQ8WXH5
Sequence Annotations
Expand
  • Reference Sequence
Find similar proteins by:  (by identity cutoff)  |  3D Structure
Entity ID: 2
MoleculeChains Sequence LengthOrganismDetailsImage
TRANSCRIPTION ELONGATION FACTOR B POLYPEPTIDE 2118Homo sapiensMutation(s): 0 
UniProt & NIH Common Fund Data Resources
Find proteins for Q15370 (Homo sapiens)
Explore Q15370 
Go to UniProtKB:  Q15370
PHAROS:  Q15370
GTEx:  ENSG00000103363 
Entity Groups  
Sequence Clusters30% Identity50% Identity70% Identity90% Identity95% Identity100% Identity
UniProt GroupQ15370
Sequence Annotations
Expand
  • Reference Sequence
Find similar proteins by:  (by identity cutoff)  |  3D Structure
Entity ID: 3
MoleculeChains Sequence LengthOrganismDetailsImage
TRANSCRIPTION ELONGATION FACTOR B POLYPEPTIDE 197Homo sapiensMutation(s): 0 
UniProt & NIH Common Fund Data Resources
Find proteins for Q15369 (Homo sapiens)
Explore Q15369 
Go to UniProtKB:  Q15369
PHAROS:  Q15369
GTEx:  ENSG00000154582 
Entity Groups  
Sequence Clusters30% Identity50% Identity70% Identity90% Identity95% Identity100% Identity
UniProt GroupQ15369
Sequence Annotations
Expand
  • Reference Sequence
Experimental Data & Validation

Experimental Data

  • Method: X-RAY DIFFRACTION
  • Resolution: 2.55 Å
  • R-Value Free: 0.223 
  • R-Value Work: 0.172 
  • R-Value Observed: 0.175 
  • Space Group: H 3
Unit Cell:
Length ( Å )Angle ( ˚ )
a = 154.77α = 90
b = 154.77β = 90
c = 67.909γ = 120
Software Package:
Software NamePurpose
REFMACrefinement
MOSFLMdata reduction
SCALAdata scaling
PHASERphasing

Structure Validation

View Full Validation Report


Entry History 

Revision History  (Full details and data files)

  • Version 1.0: 2006-08-02
    Type: Initial release
  • Version 1.1: 2011-07-13
    Changes: Advisory, Version format compliance
  • Version 1.2: 2018-01-24
    Changes: Structure summary
  • Version 1.3: 2018-02-28
    Changes: Database references, Source and taxonomy
  • Version 1.4: 2019-05-08
    Changes: Data collection, Experimental preparation
  • Version 1.5: 2023-12-13
    Changes: Data collection, Database references, Derived calculations, Other, Refinement description