1R0C

Products in the T State of Aspartate Transcarbamylase: Crystal Structure of the Phosphate and N-carbamyl-L-aspartate Ligated Enzyme


Experimental Data Snapshot

  • Method: X-RAY DIFFRACTION
  • Resolution: 2.37 Å
  • R-Value Free: 0.274 
  • R-Value Work: 0.226 
  • R-Value Observed: 0.228 

wwPDB Validation   3D Report Full Report


Ligand Structure Quality Assessment 


This is version 1.3 of the entry. See complete history


Literature

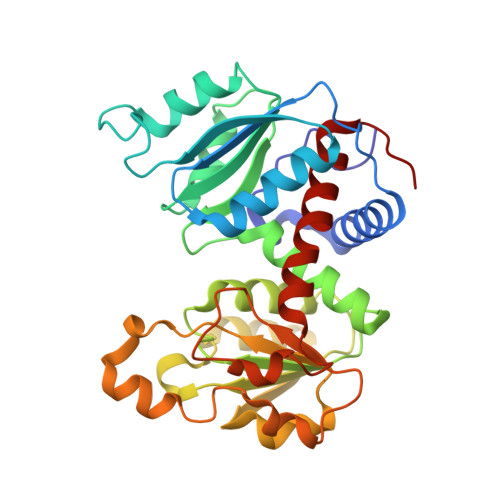
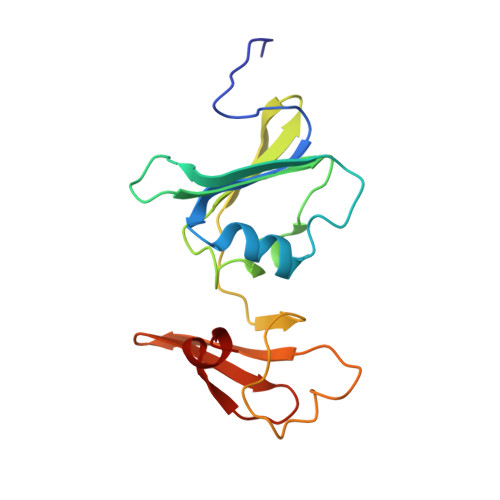
Products in the T-State of Aspartate Transcarbamylase: Crystal Structure of the Phosphate and N-Carbamyl-l-aspartate Ligated Enzyme

Huang, J.Lipscomb, W.N.

(2004) Biochemistry 43: 6422-6426

  • DOI: https://doi.org/10.1021/bi0302144
  • Primary Citation of Related Structures:  
    1R0C

  • PubMed Abstract: 

    The structure of aspartate transcarbamylase of Escherichia coli ligated to products (phosphate and N-carbamyl-l-aspartate) has been determined at 2.37 A resolution (R-factor = 0.23, R(free) = 0.27). Results might indicate a product release mode, rather than close analogues to the transition state like those found in our earlier studies of other ligands (N-phosphonacetyl-L-aspartate, carbamyl phosphate plus malonate, phosphonoacetamide plus malonate, or citrate plus phosphate). Ordered product release, first carbamylaspartate (CLA) and then phosphate, might be facilitated by a 4 A movement of phosphate from the substrate-analogue position to the product (phosphate) binding position, and by a somewhat similar release movement of the other product (CLA) relative to its analogue (citrate). This movement is consistent with earlier studies of binding of either pyrophosphate or phosphate alone [Honzatko, R. B., and Lipscomb, W. N. (1982) J. Mol. Biol. 160, 265-286].


  • Organizational Affiliation

    Department of Chemistry and Chemical Biology, Harvard University, Cambridge, Massachusetts 02138, USA.


Macromolecules
Find similar proteins by:  (by identity cutoff)  |  3D Structure
Entity ID: 1
MoleculeChains Sequence LengthOrganismDetailsImage
Aspartate carbamoyltransferase catalytic chainA,
C [auth G]
310Escherichia coliMutation(s): 0 
Gene Names: PYRB OR B4245 OR C5345 OR Z5856 OR ECS5222 OR SF4245 OR S4507
EC: 2.1.3.2
UniProt
Find proteins for P0A786 (Escherichia coli (strain K12))
Explore P0A786 
Go to UniProtKB:  P0A786
Entity Groups  
Sequence Clusters30% Identity50% Identity70% Identity90% Identity95% Identity100% Identity
UniProt GroupP0A786
Sequence Annotations
Expand
  • Reference Sequence
Find similar proteins by:  (by identity cutoff)  |  3D Structure
Entity ID: 2
MoleculeChains Sequence LengthOrganismDetailsImage
Aspartate carbamoyltransferase regulatory chainB,
D [auth H]
153Escherichia coliMutation(s): 0 
Gene Names: PYRI OR B4244 OR C5344 OR Z5855 OR ECS5221
UniProt
Find proteins for P0A7F3 (Escherichia coli (strain K12))
Explore P0A7F3 
Go to UniProtKB:  P0A7F3
Entity Groups  
Sequence Clusters30% Identity50% Identity70% Identity90% Identity95% Identity100% Identity
UniProt GroupP0A7F3
Sequence Annotations
Expand
  • Reference Sequence
Experimental Data & Validation

Experimental Data

  • Method: X-RAY DIFFRACTION
  • Resolution: 2.37 Å
  • R-Value Free: 0.274 
  • R-Value Work: 0.226 
  • R-Value Observed: 0.228 
  • Space Group: H 3
Unit Cell:
Length ( Å )Angle ( ˚ )
a = 128.776α = 90
b = 128.776β = 90
c = 198.017γ = 120
Software Package:
Software NamePurpose
HKL-2000data collection
SCALEPACKdata scaling
AMoREphasing
CNSrefinement
HKL-2000data reduction

Structure Validation

View Full Validation Report


Ligand Structure Quality Assessment 


Entry History 

Deposition Data

Revision History  (Full details and data files)

  • Version 1.0: 2004-06-08
    Type: Initial release
  • Version 1.1: 2008-04-29
    Changes: Version format compliance
  • Version 1.2: 2011-07-13
    Changes: Derived calculations, Version format compliance
  • Version 1.3: 2023-08-23
    Changes: Data collection, Database references, Derived calculations, Refinement description