6DIG

Crystal structure of DQA1*01:02/DQB1*06:02 in complex with a hypocretin peptide


Experimental Data Snapshot

  • Method: X-RAY DIFFRACTION
  • Resolution: 2.00 Å
  • R-Value Free: 0.255 
  • R-Value Work: 0.216 
  • R-Value Observed: 0.218 

Starting Model: experimental
View more details

wwPDB Validation   3D Report Full Report


Ligand Structure Quality Assessment 


This is version 2.1 of the entry. See complete history


Literature

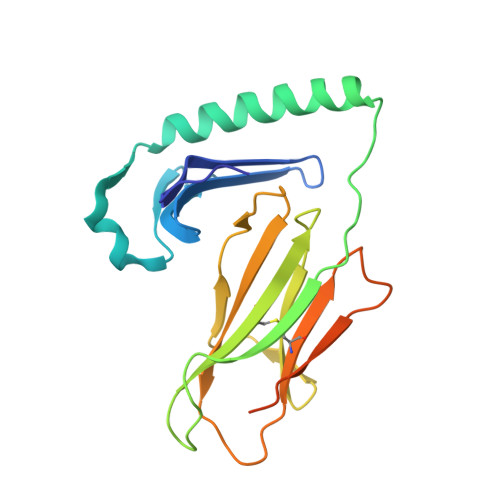
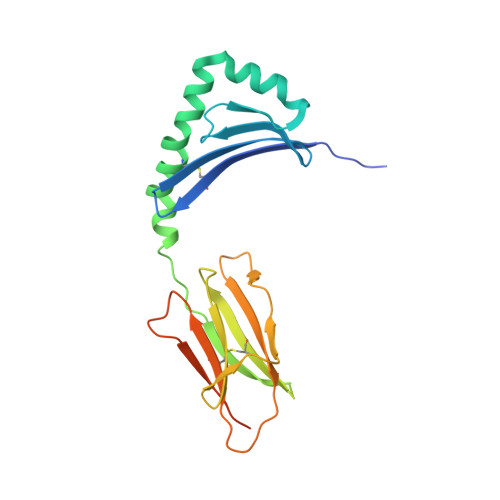
In vivo clonal expansion and phenotypes of hypocretin-specific CD4+T cells in narcolepsy patients and controls.

Jiang, W.Birtley, J.R.Hung, S.C.Wang, W.Chiou, S.H.Macaubas, C.Kornum, B.Tian, L.Huang, H.Adler, L.Weaver, G.Lu, L.Ilstad-Minnihan, A.Somasundaram, S.Ayyangar, S.Davis, M.M.Stern, L.J.Mellins, E.D.

(2019) Nat Commun 10: 5247-5247

  • DOI: https://doi.org/10.1038/s41467-019-13234-x
  • Primary Citation of Related Structures:  
    6DIG

  • PubMed Abstract: 

    Individuals with narcolepsy suffer from abnormal sleep patterns due to loss of neurons that uniquely supply hypocretin (HCRT). Previous studies found associations of narcolepsy with the human leukocyte antigen (HLA)-DQ6 allele and T-cell receptor α (TRA) J24 gene segment and also suggested that in vitro-stimulated T cells can target HCRT. Here, we present evidence of in vivo expansion of DQ6-HCRT tetramer + /TRAJ24 + /CD4 + T cells in DQ6 + individuals with and without narcolepsy. We identify related TRAJ24 + TCRαβ clonotypes encoded by identical α/β gene regions from two patients and two controls. TRAJ24-G allele + clonotypes only expand in the two patients, whereas a TRAJ24-C allele + clonotype expands in a control. A representative tetramer + /G-allele + TCR shows signaling reactivity to the epitope HCRT 87-97 . Clonally expanded G-allele + T cells exhibit an unconventional effector phenotype. Our analysis of in vivo expansion of HCRT-reactive TRAJ24 + cells opens an avenue for further investigation of the autoimmune contribution to narcolepsy development.


  • Organizational Affiliation

    Department of Pediatrics-Human Gene Therapy, Stanford University School of medicine, Stanford, CA, 94305, USA. wjiang6@stanford.edu.


Macromolecules
Find similar proteins by:  (by identity cutoff)  |  3D Structure
Entity ID: 1
MoleculeChains Sequence LengthOrganismDetailsImage
MHC class II HLA-DQ-alpha chain207Homo sapiensMutation(s): 0 
Gene Names: HLA-DQA1
UniProt
Find proteins for Q30066 (Homo sapiens)
Explore Q30066 
Go to UniProtKB:  Q30066
Entity Groups  
Sequence Clusters30% Identity50% Identity70% Identity90% Identity95% Identity100% Identity
UniProt GroupQ30066
Glycosylation
Glycosylation Sites: 1
Sequence Annotations
Expand
  • Reference Sequence
Find similar proteins by:  (by identity cutoff)  |  3D Structure
Entity ID: 2
MoleculeChains Sequence LengthOrganismDetailsImage
HLA class II histocompatibility antigen, DQ beta 1 chain215Homo sapiensMutation(s): 0 
Gene Names: HLA-DQB1
UniProt & NIH Common Fund Data Resources
Find proteins for Q5SU54 (Homo sapiens)
Explore Q5SU54 
Go to UniProtKB:  Q5SU54
GTEx:  ENSG00000179344 
Entity Groups  
Sequence Clusters30% Identity50% Identity70% Identity90% Identity95% Identity100% Identity
UniProt GroupQ5SU54
Glycosylation
Glycosylation Sites: 1
Sequence Annotations
Expand
  • Reference Sequence

Find similar proteins by:  Sequence   |   3D Structure  

Entity ID: 3
MoleculeChains Sequence LengthOrganismDetailsImage
13-mer peptide: ALA-GLY-ASN-HIS-ALA-ALA-GLY-ILE-LEU-THR-LEU-GLY-LYS13Homo sapiensMutation(s): 0 
Entity Groups  
Sequence Clusters30% Identity50% Identity70% Identity90% Identity95% Identity100% Identity
Sequence Annotations
Expand
  • Reference Sequence
Oligosaccharides

Help

Entity ID: 4
MoleculeChains Length2D Diagram Glycosylation3D Interactions
2-acetamido-2-deoxy-beta-D-glucopyranose-(1-4)-2-acetamido-2-deoxy-beta-D-glucopyranose
D
2N-Glycosylation
Glycosylation Resources
GlyTouCan:  G42666HT
GlyCosmos:  G42666HT
GlyGen:  G42666HT
Small Molecules
Experimental Data & Validation

Experimental Data

  • Method: X-RAY DIFFRACTION
  • Resolution: 2.00 Å
  • R-Value Free: 0.255 
  • R-Value Work: 0.216 
  • R-Value Observed: 0.218 
  • Space Group: C 1 2 1
Unit Cell:
Length ( Å )Angle ( ˚ )
a = 63.666α = 90
b = 89.596β = 99.517
c = 90.928γ = 90
Software Package:
Software NamePurpose
phenix.refinerefinement
PHENIXrefinement
xia2data reduction
SCALAdata scaling
PHASERphasing

Structure Validation

View Full Validation Report


Ligand Structure Quality Assessment 


Entry History & Funding Information

Deposition Data


Funding OrganizationLocationGrant Number
National Institutes of Health/National Human Genome Research Institute (NIH/NHGRI)United States5 U01 AI101990

Revision History  (Full details and data files)

  • Version 1.0: 2019-05-08
    Type: Initial release
  • Version 1.1: 2019-11-27
    Changes: Database references, Structure summary
  • Version 1.2: 2019-12-04
    Changes: Database references
  • Version 1.3: 2019-12-18
    Changes: Author supporting evidence
  • Version 2.0: 2020-07-29
    Type: Remediation
    Reason: Carbohydrate remediation
    Changes: Advisory, Atomic model, Data collection, Derived calculations, Structure summary
  • Version 2.1: 2023-10-11
    Changes: Data collection, Database references, Refinement description, Structure summary