5ZMW

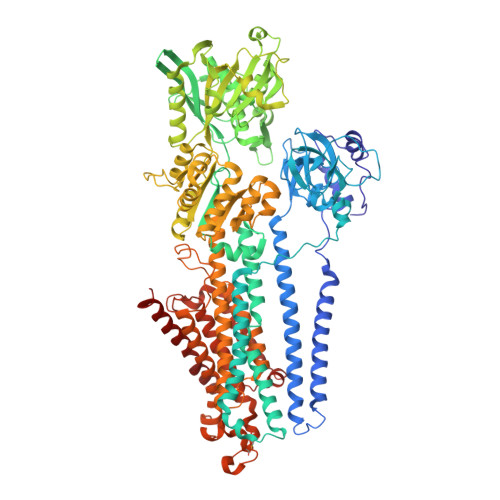
Crystal structure of the E309Q mutant of SR Ca2+-ATPase in E2(TG)


Experimental Data Snapshot

  • Method: X-RAY DIFFRACTION
  • Resolution: 2.50 Å
  • R-Value Free: 0.259 
  • R-Value Work: 0.222 
  • R-Value Observed: 0.223 

wwPDB Validation   3D Report Full Report


Ligand Structure Quality Assessment 


This is version 1.0 of the entry. See complete history


Literature

Mechanism of the E2 to E1 transition in Ca2+pump revealed by crystal structures of gating residue mutants.

Tsunekawa, N.Ogawa, H.Tsueda, J.Akiba, T.Toyoshima, C.

(2018) Proc Natl Acad Sci U S A 115: 12722-12727

  • DOI: https://doi.org/10.1073/pnas.1815472115
  • Primary Citation of Related Structures:  
    5ZMV, 5ZMW

  • PubMed Abstract: 

    Ca 2+ -ATPase of sarcoplasmic reticulum (SERCA1a) pumps two Ca 2+ per ATP hydrolyzed from the cytoplasm and two or three protons in the opposite direction. In the E2 state, after transferring Ca 2+ into the lumen of sarcoplasmic reticulum, all of the acidic residues that coordinate Ca 2+ are thought to be protonated, including the gating residue Glu309. Therefore a Glu309Gln substitution is not expected to significantly perturb the structure. Here we report crystal structures of the Glu309Gln and Glu309Ala mutants of SERCA1a under E2 conditions. The Glu309Gln mutant exhibits, unexpectedly, large structural rearrangements in both the cytoplasmic and transmembrane domains, apparently uncoupling them. However, the structure definitely represents E2 and, together with the help of quantum chemical calculations, allows us to postulate a mechanism for the E2 → E1 transition triggered by deprotonation of Glu309.


  • Organizational Affiliation

    Institute for Quantitative Biosciences, The University of Tokyo, 113-0032 Tokyo, Japan.


Macromolecules
Find similar proteins by:  (by identity cutoff)  |  3D Structure
Entity ID: 1
MoleculeChains Sequence LengthOrganismDetailsImage
Sarcoplasmic/endoplasmic reticulum calcium ATPase 11,000Oryctolagus cuniculusMutation(s): 1 
Gene Names: ATP2A1
EC: 3.6.3.8 (PDB Primary Data), 7.2.2.10 (UniProt)
Membrane Entity: Yes 
UniProt
Find proteins for P04191 (Oryctolagus cuniculus)
Explore P04191 
Go to UniProtKB:  P04191
Entity Groups  
Sequence Clusters30% Identity50% Identity70% Identity90% Identity95% Identity100% Identity
UniProt GroupP04191
Sequence Annotations
Expand
  • Reference Sequence
Small Molecules
Ligands 4 Unique
IDChains Name / Formula / InChI Key2D Diagram3D Interactions
TG1
Query on TG1

Download Ideal Coordinates CCD File 
D [auth A]OCTANOIC ACID [3S-[3ALPHA, 3ABETA, 4ALPHA, 6BETA, 6ABETA, 7BETA, 8ALPHA(Z), 9BALPHA]]-6-(ACETYLOXY)-2,3,-3A,4,5,6,6A,7,8,9B-DECAHYDRO-3,3A-DIHYDROXY-3,6,9-TRIMETHYL-8-[(2-METHYL-1-OXO-2-BUTENYL)OX Y]-2-OXO-4-(1-OXOBUTOXY)-AZULENO[4,5-B]FURAN-7-YL ESTER
C34 H50 O12
IXFPJGBNCFXKPI-FSIHEZPISA-N
DMU
Query on DMU

Download Ideal Coordinates CCD File 
E [auth A],
F [auth A]
DECYL-BETA-D-MALTOPYRANOSIDE
C22 H42 O11
WOQQAWHSKSSAGF-WXFJLFHKSA-N
SO4
Query on SO4

Download Ideal Coordinates CCD File 
C [auth A]SULFATE ION
O4 S
QAOWNCQODCNURD-UHFFFAOYSA-L
NA
Query on NA

Download Ideal Coordinates CCD File 
B [auth A]SODIUM ION
Na
FKNQFGJONOIPTF-UHFFFAOYSA-N
Binding Affinity Annotations 
IDSourceBinding Affinity
TG1 BindingDB:  5ZMW Ki: 0.1 (nM) from 1 assay(s)
Kd: 0.2 (nM) from 1 assay(s)
IC50: min: 0.2, max: 3.9 (nM) from 2 assay(s)
Experimental Data & Validation

Experimental Data

  • Method: X-RAY DIFFRACTION
  • Resolution: 2.50 Å
  • R-Value Free: 0.259 
  • R-Value Work: 0.222 
  • R-Value Observed: 0.223 
  • Space Group: P 21 21 2
Unit Cell:
Length ( Å )Angle ( ˚ )
a = 260.977α = 90
b = 86.895β = 90
c = 60.211γ = 90
Software Package:
Software NamePurpose
PHENIXrefinement
DENZOdata reduction
SCALEPACKdata scaling
MOLREPphasing

Structure Validation

View Full Validation Report


Ligand Structure Quality Assessment 


Entry History & Funding Information

Deposition Data


Funding OrganizationLocationGrant Number
Japan--

Revision History  (Full details and data files)

  • Version 1.0: 2019-04-03
    Type: Initial release