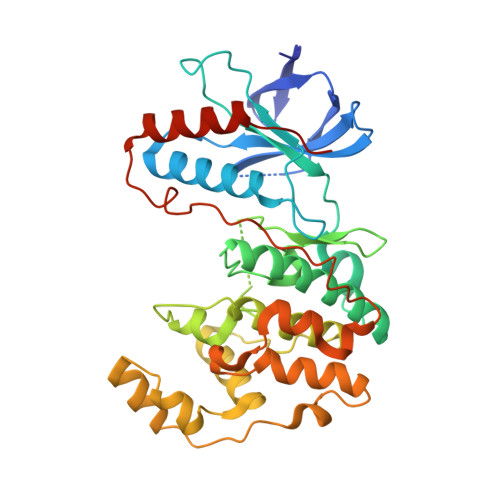
3GCS

Human P38 MAP kinase in complex with Sorafenib


Experimental Data Snapshot

  • Method: X-RAY DIFFRACTION
  • Resolution: 2.10 Å
  • R-Value Free: 0.262 
  • R-Value Work: 0.202 
  • R-Value Observed: 0.204 

Starting Model: experimental
View more details

wwPDB Validation   3D Report Full Report


Ligand Structure Quality Assessment 


This is version 1.5 of the entry. See complete history


Literature

Development of a fluorescent-tagged kinase assay system for the detection and characterization of allosteric kinase inhibitors.

Simard, J.R.Getlik, M.Grutter, C.Pawar, V.Wulfert, S.Rabiller, M.Rauh, D.

(2009) J Am Chem Soc 131: 13286-13296

  • DOI: https://doi.org/10.1021/ja902010p
  • Primary Citation of Related Structures:  
    3GCP, 3GCQ, 3GCS, 3GCU, 3GCV

  • PubMed Abstract: 

    Kinase disregulation disrupts the intricate network of intracellular signaling pathways and contributes to the onset of diseases such as cancer. Although several kinase inhibitors are on the market, inhibitor selectivity and drug resistance mutations persist as fundamental challenges in the development of effective long-term treatments. Chemical entities binding to less conserved allosteric sites would be expected to offer new opportunities for scaffold development. Because no high-throughput method was previously available, we developed a fluorescence-based kinase binding assay for identifying and characterizing ligands which stabilize the inactive kinase conformation. Here, we present a description of the development and validation of this assay using the serine/threonine kinase p38alpha. By covalently attaching fluorophores to the activation loop of the kinase, we were able to detect conformational changes and measure the K(d), k(on), and k(off) associated with the binding and dissociation of ligands to the allosteric pocket. We report the SAR of a synthesized focused library of pyrazolourea derivatives, a scaffold known to bind with high affinity to the allosteric pocket of p38alpha. Additionally, we used protein X-ray crystallography together with our assay to examine the binding and dissociation kinetics to characterize potent quinazoline- and quinoline-based type II inhibitors, which also utilize this binding pocket in p38alpha. Last, we identified the b-Raf inhibitor sorafenib as a potent low nanomolar inhibitor of p38alpha and used protein X-ray crystallography to confirm a unique binding mode to the inactive kinase conformation.


  • Organizational Affiliation

    Chemical Genomics Centre of the Max Planck Society, Otto-Hahn-Strasse 15, D-44227 Dortmund, Germany.


Macromolecules
Find similar proteins by:  (by identity cutoff)  |  3D Structure
Entity ID: 1
MoleculeChains Sequence LengthOrganismDetailsImage
Mitogen-activated protein kinase 14360Homo sapiensMutation(s): 4 
Gene Names: MAPK14CSBPCSBP1CSBP2CSPB1MXI2
EC: 2.7.11.24
UniProt & NIH Common Fund Data Resources
Find proteins for Q16539 (Homo sapiens)
Explore Q16539 
Go to UniProtKB:  Q16539
PHAROS:  Q16539
GTEx:  ENSG00000112062 
Entity Groups  
Sequence Clusters30% Identity50% Identity70% Identity90% Identity95% Identity100% Identity
UniProt GroupQ16539
Sequence Annotations
Expand
  • Reference Sequence
Small Molecules
Ligands 2 Unique
IDChains Name / Formula / InChI Key2D Diagram3D Interactions
BAX
Query on BAX

Download Ideal Coordinates CCD File 
B [auth A]4-{4-[({[4-CHLORO-3-(TRIFLUOROMETHYL)PHENYL]AMINO}CARBONYL)AMINO]PHENOXY}-N-METHYLPYRIDINE-2-CARBOXAMIDE
C21 H16 Cl F3 N4 O3
MLDQJTXFUGDVEO-UHFFFAOYSA-N
BOG
Query on BOG

Download Ideal Coordinates CCD File 
C [auth A]octyl beta-D-glucopyranoside
C14 H28 O6
HEGSGKPQLMEBJL-RKQHYHRCSA-N
Binding Affinity Annotations 
IDSourceBinding Affinity
BAX PDBBind:  3GCS Kd: 56 (nM) from 1 assay(s)
BindingDB:  3GCS Kd: min: 260, max: 1.00e+4 (nM) from 3 assay(s)
IC50: min: 37, max: 3200 (nM) from 7 assay(s)
Experimental Data & Validation

Experimental Data

  • Method: X-RAY DIFFRACTION
  • Resolution: 2.10 Å
  • R-Value Free: 0.262 
  • R-Value Work: 0.202 
  • R-Value Observed: 0.204 
  • Space Group: P 21 21 21
Unit Cell:
Length ( Å )Angle ( ˚ )
a = 67.48α = 90
b = 69.85β = 90
c = 74.8γ = 90
Software Package:
Software NamePurpose
DENZOdata reduction
SCALEPACKdata scaling
PHASERphasing
REFMACrefinement
PDB_EXTRACTdata extraction
XDSdata scaling
XSCALEdata scaling

Structure Validation

View Full Validation Report


Ligand Structure Quality Assessment 


Entry History 

Deposition Data

Revision History  (Full details and data files)

  • Version 1.0: 2009-06-09
    Type: Initial release
  • Version 1.1: 2011-07-13
    Changes: Version format compliance
  • Version 1.2: 2017-11-01
    Changes: Refinement description
  • Version 1.3: 2020-07-29
    Type: Remediation
    Reason: Carbohydrate remediation
    Changes: Data collection, Database references, Derived calculations, Structure summary
  • Version 1.4: 2021-10-20
    Changes: Database references, Structure summary
  • Version 1.5: 2023-09-06
    Changes: Data collection, Refinement description