


Exploring the effect of an allosteric site on conformational coupling in CheY
Immormino, R.M., McDonald, L.S., Lee, A.L., Bourret, R.B.To be published.
Experimental Data Snapshot
Starting Model: experimental
View more details
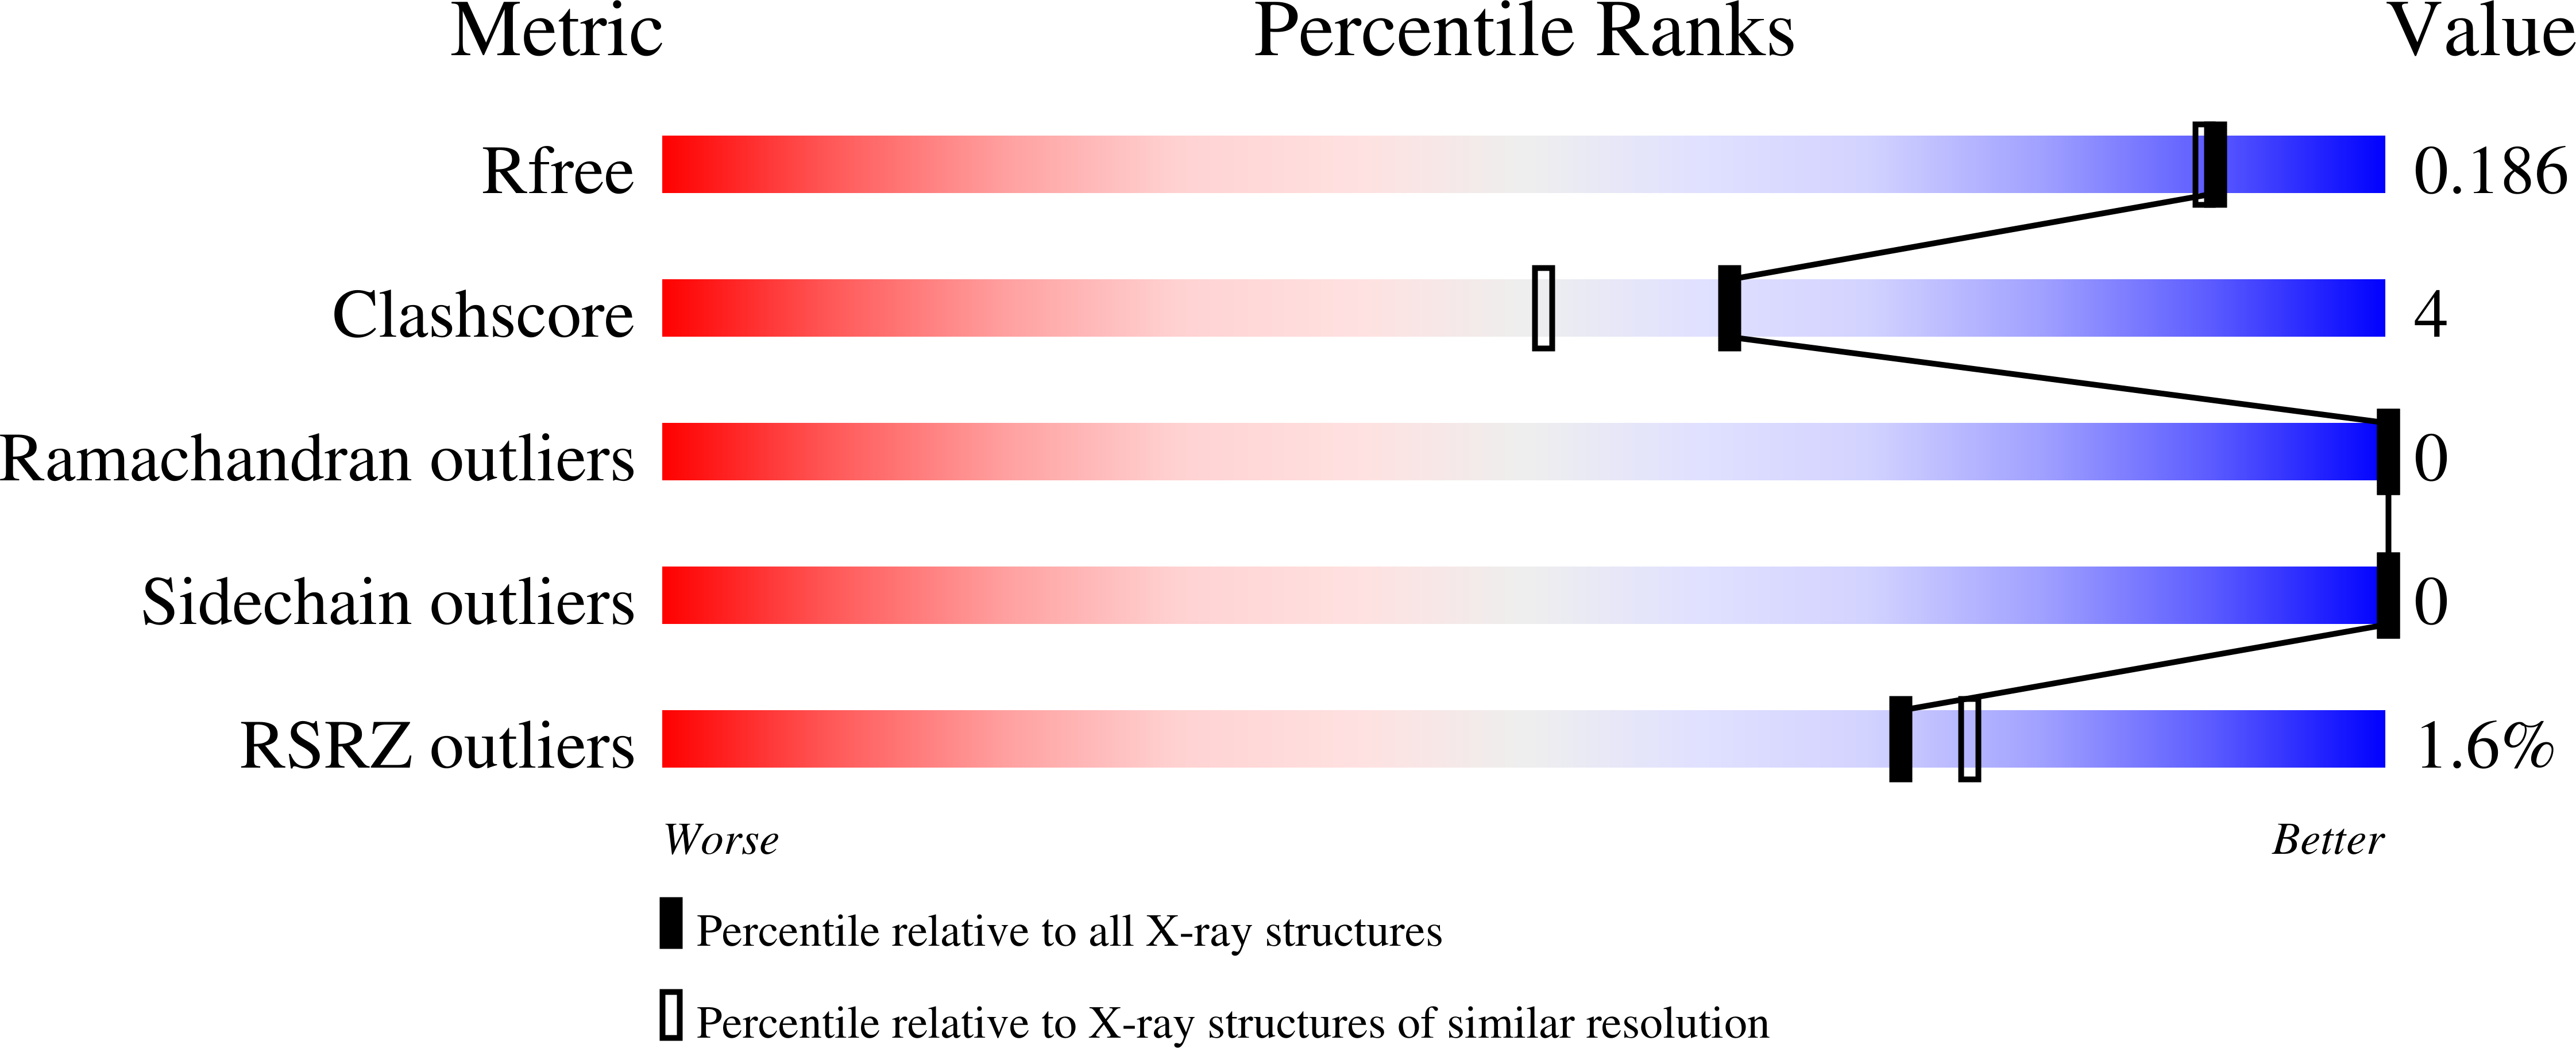
wwPDB Validation 3D Report Full Report
Entity ID: 1 | |||||
|---|---|---|---|---|---|
| Molecule | Chains | Sequence Length | Organism | Details | Image |
| Chemotaxis protein CheY | 129 | Escherichia coli K-12 | Mutation(s): 1 Gene Names: cheY | 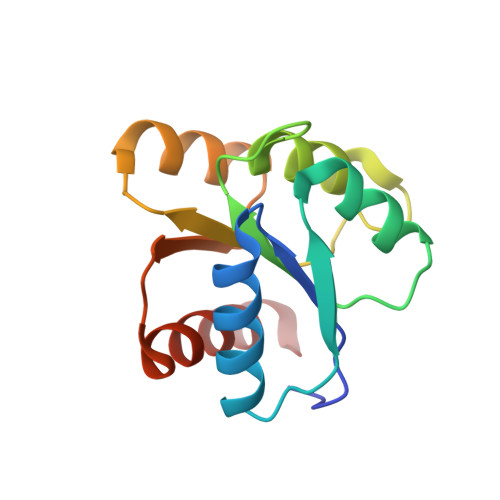 | |
UniProt | |||||
Find proteins for P0AE67 (Escherichia coli (strain K12)) Explore P0AE67 Go to UniProtKB: P0AE67 | |||||
Entity Groups | |||||
| Sequence Clusters | 30% Identity50% Identity70% Identity90% Identity95% Identity100% Identity | ||||
| UniProt Group | P0AE67 | ||||
Sequence AnnotationsExpand | |||||
| |||||
| Ligands 1 Unique | |||||
|---|---|---|---|---|---|
| ID | Chains | Name / Formula / InChI Key | 2D Diagram | 3D Interactions | |
| MG Query on MG | C [auth A], D [auth B] | MAGNESIUM ION Mg JLVVSXFLKOJNIY-UHFFFAOYSA-N |  | ||
| Length ( Å ) | Angle ( ˚ ) |
|---|---|
| a = 57.24 | α = 90 |
| b = 52.952 | β = 96.12 |
| c = 37.321 | γ = 90 |
| Software Name | Purpose |
|---|---|
| HKL-2000 | data collection |
| PHASER | phasing |
| PHENIX | refinement |
| HKL-2000 | data reduction |
| HKL-2000 | data scaling |
RCSB PDB (citation) is hosted by
RCSB PDB is a member of the

